
If you'd like to learn more about climate change, here are some trustworthy resources

Introductions: ↑ ↑
1. Climate Curious (alt or here), by environmentalist David Siegel: What he learned about climate change. (This is his web site.)
2. PragerU videos on climate, energy, and the environment (most of them are about five minutes long, by top experts).
3. 2018 Annual GWPF Lecture: Global Warming For The Two Cultures, by Prof. Richard Lindzen.
Debates: ↑

4. BestSchools: Karoly/Tamblyn—Happer Dialogue on Global Warming, 2016-2017.
An in-depth, balanced, written debate, between leading experts on both sides of the issue.
5. The SOHO Forum in Manhattan has hosted two debates between a top scientist on each side of the climate debate:
6. IQ2US Debate: Is Global Warming A Crisis? (video) was a 2007 televised debate between three top climate experts on each side,
which is still surprisingly timely. ↑
(see also: #11, below, the 2014 APS Workshop)
Amicus brief: ↑

7. Three top scientists briefed the judge on climate science, in the 2018 Calif v. BP lawsuit. It was educational
for him, and it probably will be for you, too.
Physics & geophysics: ↑↑↑↑

8. The warming effect of CO2 and other so-called “greenhouse gases” is through what is called “radiative forcing.” For an excellent
discussion of it I recommend this 2014 UNC Physics Colloquium by Princeton atmospheric physicist Prof. Will Happer.
9. Wilson, 2012, Simple model to estimate the contribution of atmospheric CO2 to the Earth's greenhouse effect.
10. Pierrehumbert, 2011, Infrared radiation and planetary temperature (and discussion).
11.
In 2014, the American Physical Society held a seven hour long “Climate Change Statement Review Workshop,” in which a panel
of leading climate experts discussed the science of climate change, including a lot of discussion of climate sensitivity.
The transcript is a daunting 573 pages long, but that's double-spaced and only about 135 words per page, and
it is very educational. ↑
How much warming are we talking about, anyhow? ↑ The WMO estimates that since the “pre-industrial” mid-to-late-1800s (late Little Ice Age) the Earth has warmed an average of
1.15±0.13 °C.
So, what is the significance of that?
The WMO estimates that since the “pre-industrial” mid-to-late-1800s (late Little Ice Age) the Earth has warmed an average of
1.15±0.13 °C.
So, what is the significance of that?
12. 1°C is the temperature change you get from an elevation change of about 500 feet.
13. At mid-latitudes, 1°C is about the temperature change you get from a latitude change of about 60 miles.
14. 1°C is less than the hysteresis (a/k/a “dead zone”
or “dead band”) in your home thermostat, which is probably 2-3°F. Your home's “constant” indoor temperatures
are continually fluctuating that much, and you probably don't even notice it.
15. In the American Midwest, farmers can fully compensate for 1°C of climate change by adjusting planting dates by
about six days.
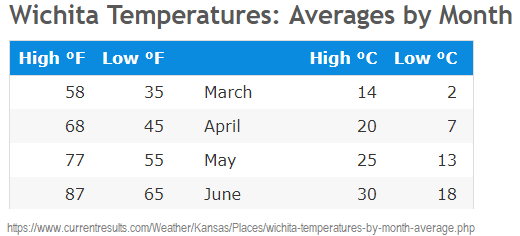
16. Growing ranges for most important crops include climate zones
with average temperatures that vary by tens of °C. Major crops like corn, wheat, potatoes and soybeans are produced
from Mexico to Canada.
Compared to that, 1°C is negligible.
Sea-level rise has not significantly accelerated: ↑ (Many sites show no detectable acceleration, and at some sites sea-level is falling. The best
studies of large numbers of high quality coastal sea-level measurement records have reported detecting a negligible average acceleration of
about 0.01mm/yr2. If that amount of acceleration were to continue for 150 years
it would add four inches to sea-level.)
(Many sites show no detectable acceleration, and at some sites sea-level is falling. The best
studies of large numbers of high quality coastal sea-level measurement records have reported detecting a negligible average acceleration of
about 0.01mm/yr2. If that amount of acceleration were to continue for 150 years
it would add four inches to sea-level.)
17. www.sealevel.info (shameless promotion of my own web site -DAB).
18. Clickable thumbnails for NOAA's entire 2016 list of 375 long term trend tide stations.
19. “Acceleration” primer. (Do you know how
to recognize “acceleration” in a graph?)
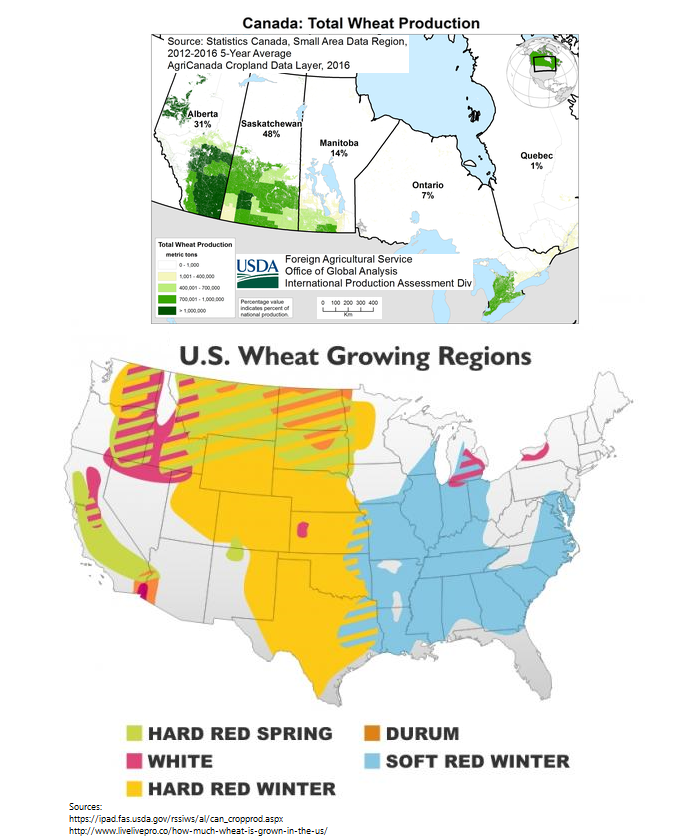
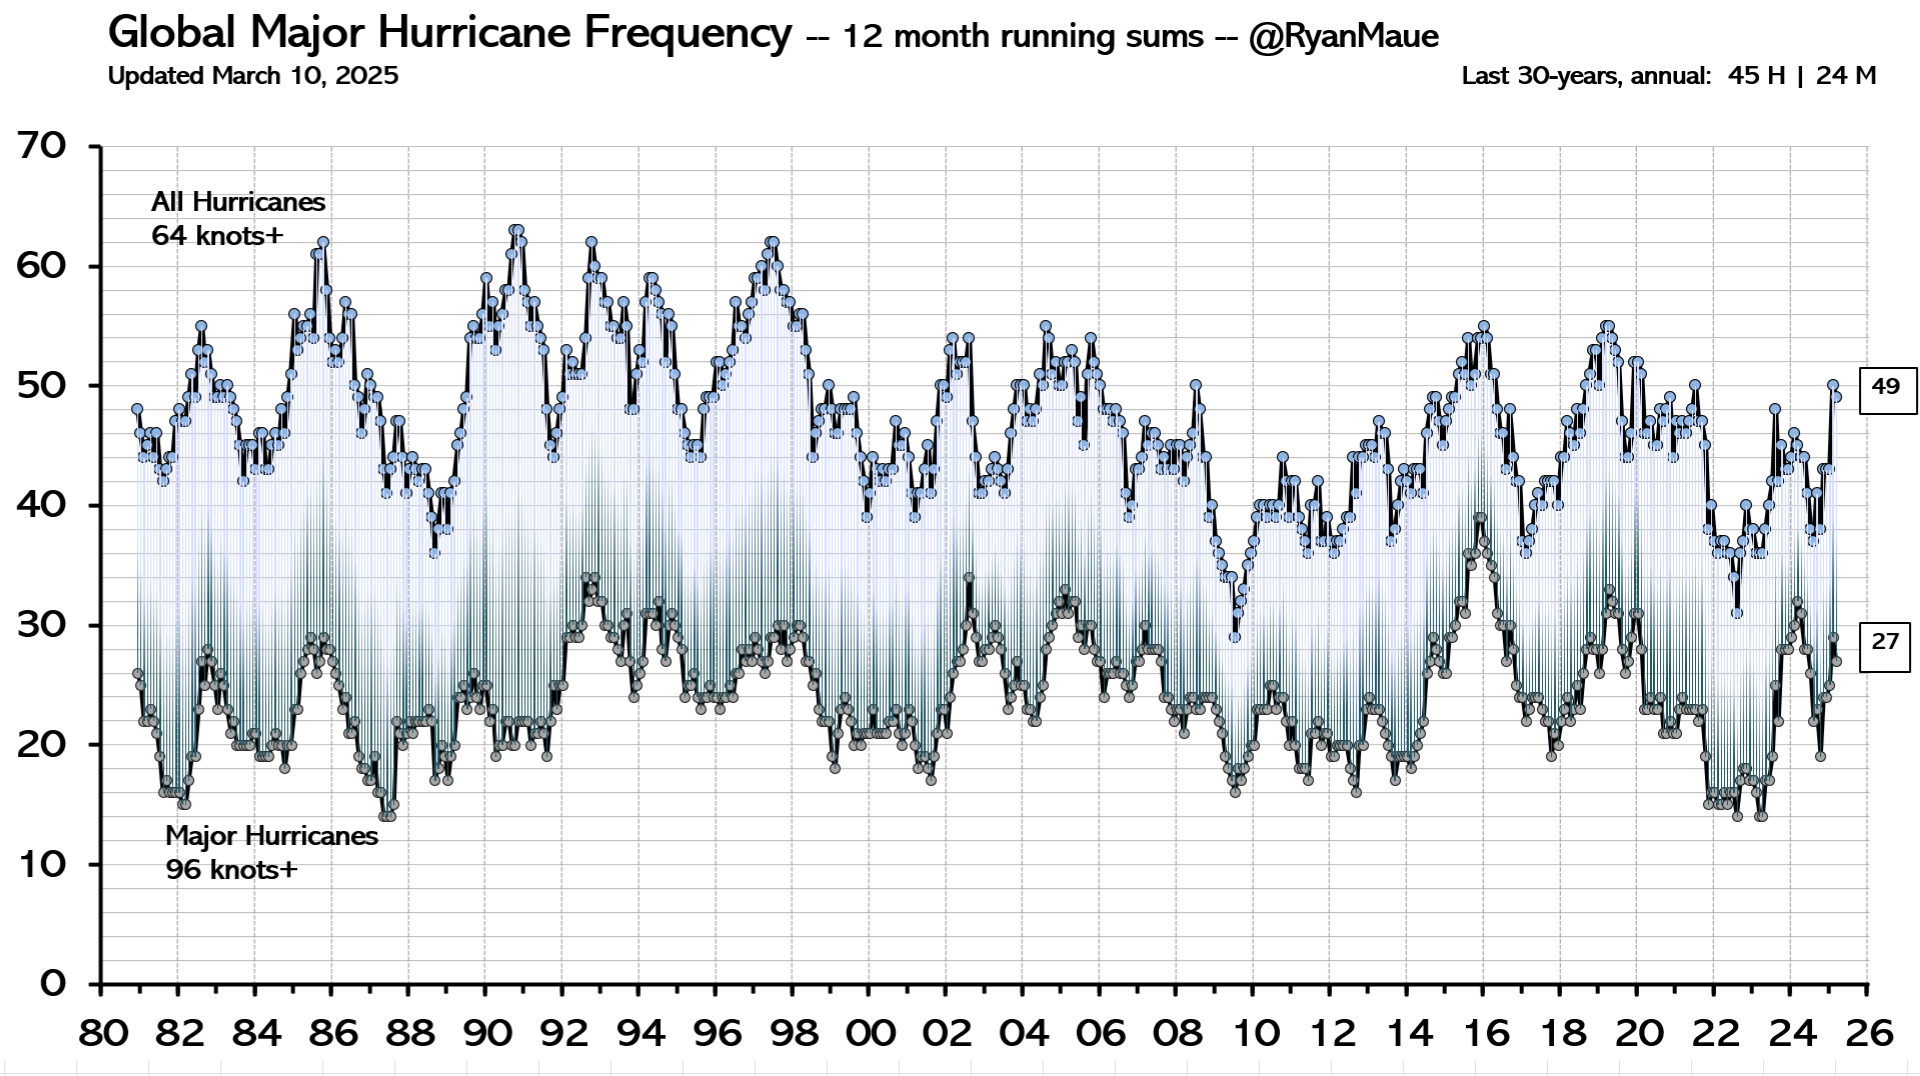
Hurricanes & tropical cyclones are not worsening: ↑

20. Lin & Chan (2015), Recent decrease in typhoon destructive potential and global warming implications. Nature Communications, doi:10.1038/ncomms8182.
21. Global Hurricane Frequency graph (twelve month running sums), from ClimateAtlas.com/tropical/.
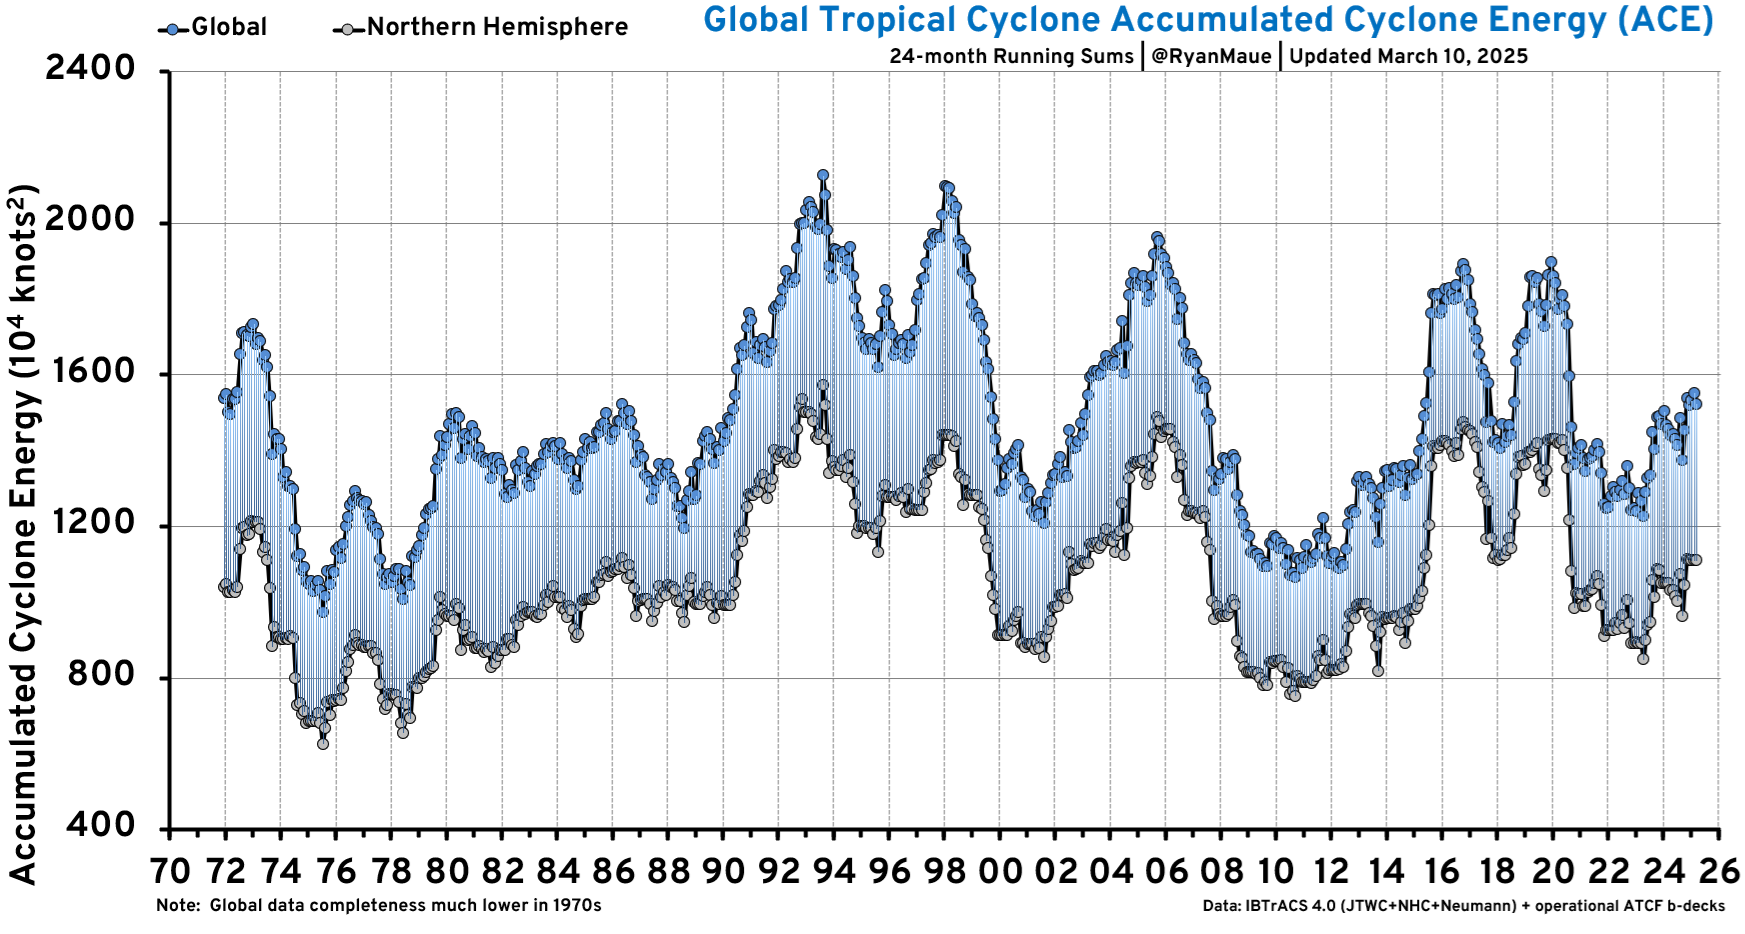
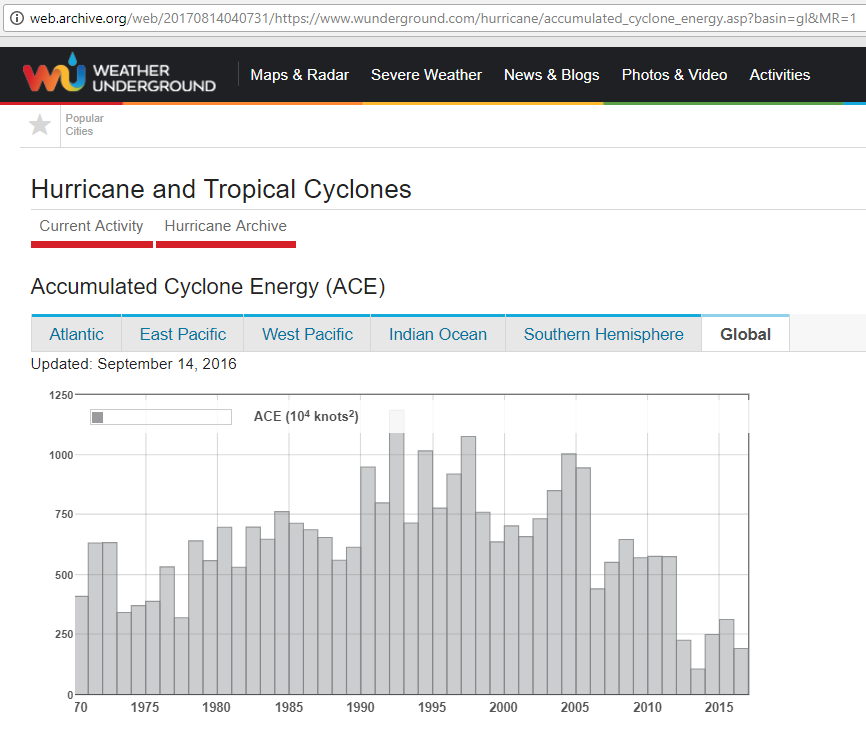
22. Global Tropical Cyclone Accumulated Cyclone Energy graph (ACE), from ClimateAtlas.com/tropical/
(or similar but older graph from wunderground.com).
23. Alimonti & Mariani (2023). Is the number of global natural disasters increasing?,
Environmental Hazards, doi:10.1080/17477891.2023.2239807. (See also these discussions of their 2022 paper:
[1][2][3].)
Tornadoes are becoming less destructive: ↑

24. 2018 US tornadoes lowest in 65 years of record-keeping, by meteorologist Anthony Watts.
25. NOAA: U.S. Annual Count
of Strong to Violent Tornadoes (F3+), 1954 through 2014 (graph).
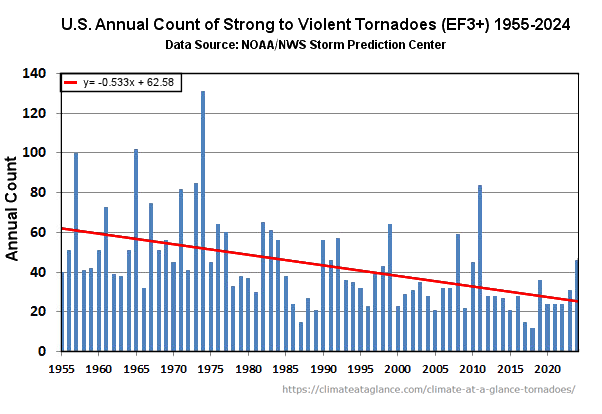
26. Climate at a Glance: Tornadoes, by Heartland Institute
(graph).
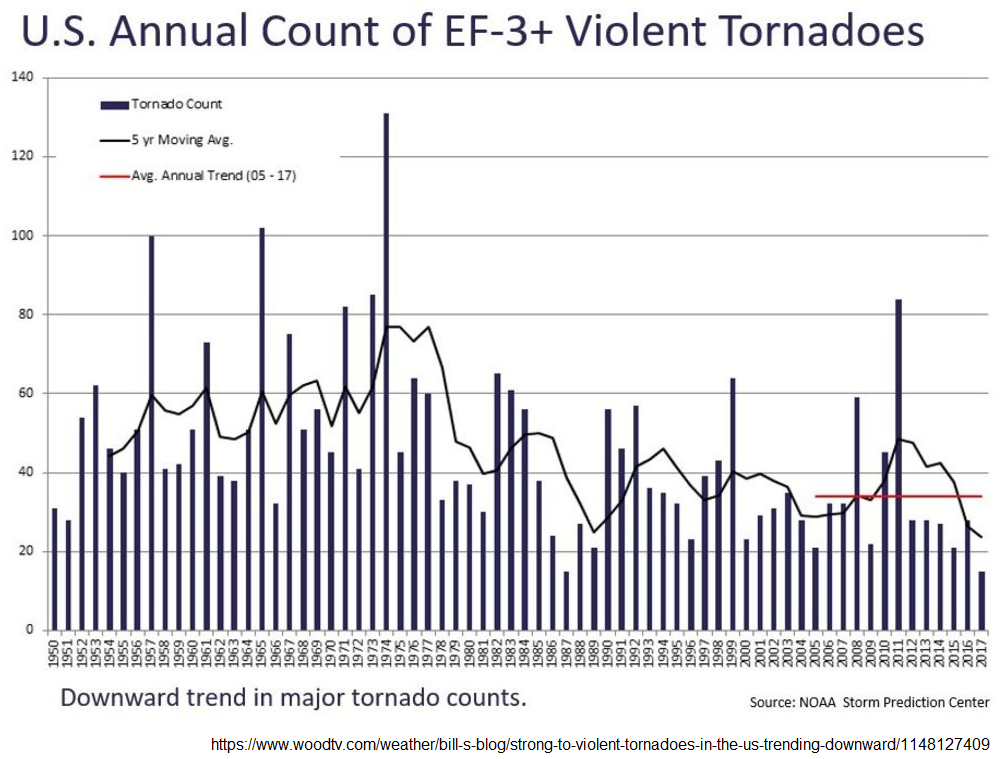
27. WoodTV:
Strong to Violent Tornadoes in the U.S. Trending Downward, by meteorologist Bill Steffen
(graph).
28. Simmons, Sutter & Pielke (2013). Normalized tornado damage in the United States: 1950-2011, Environmental Hazards, Vol. 12, No. 2, 132 147, doi:10.1080/17477891.2012.738642.
29. Zhang, et al (2023). Time trends in losses from major tornadoes in the United States. Weather and Climate Extremes, Volume 41, 100579. doi:10.1016/j.wace.2023.100579.
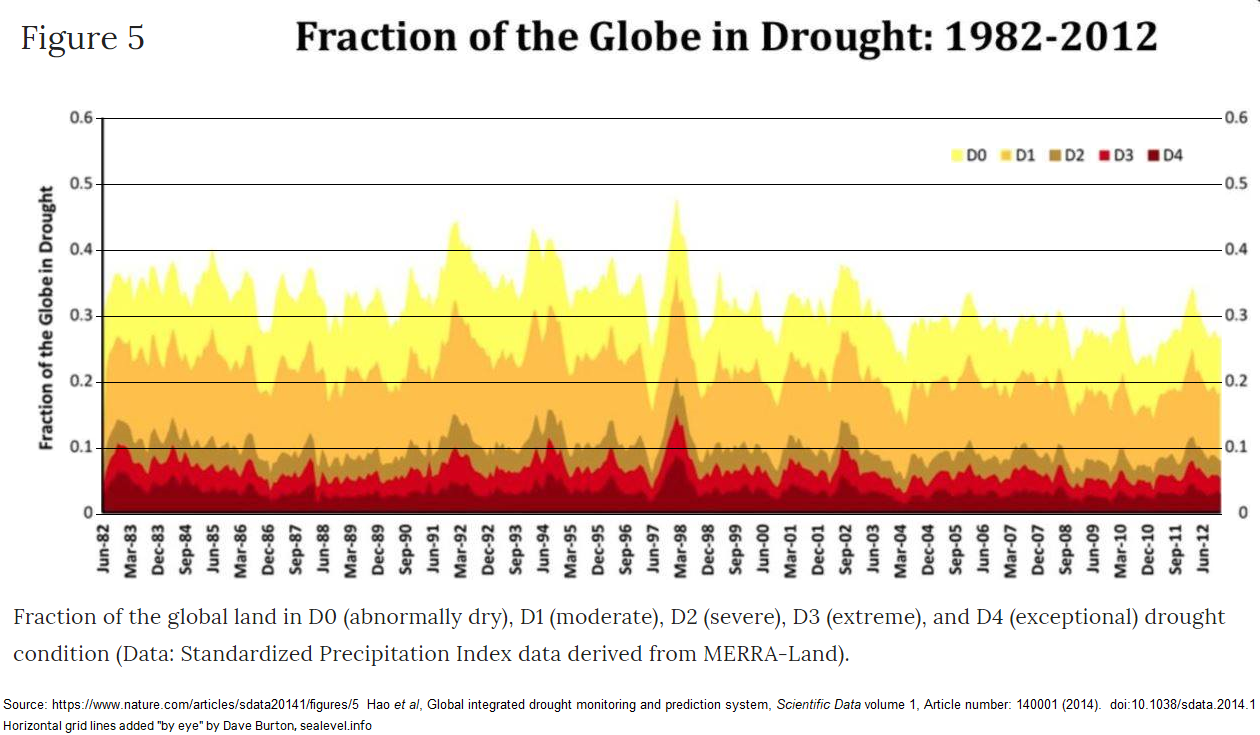
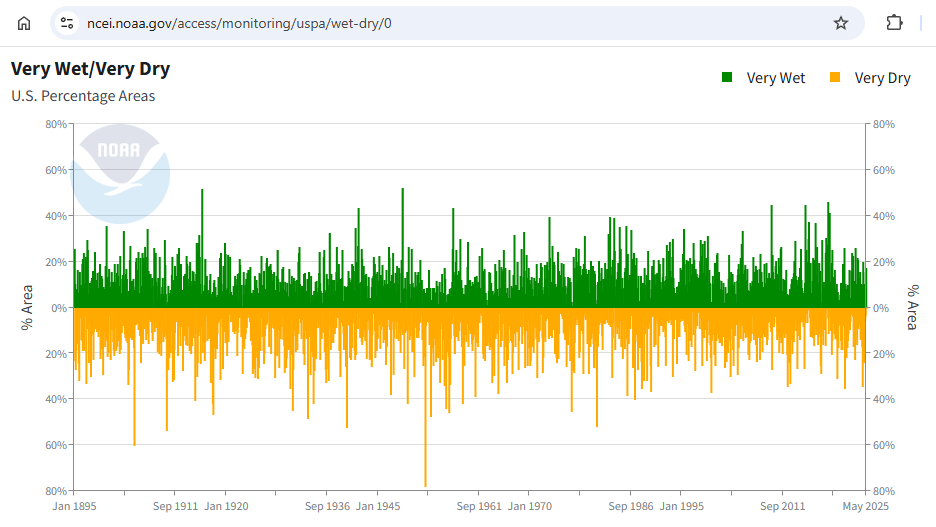
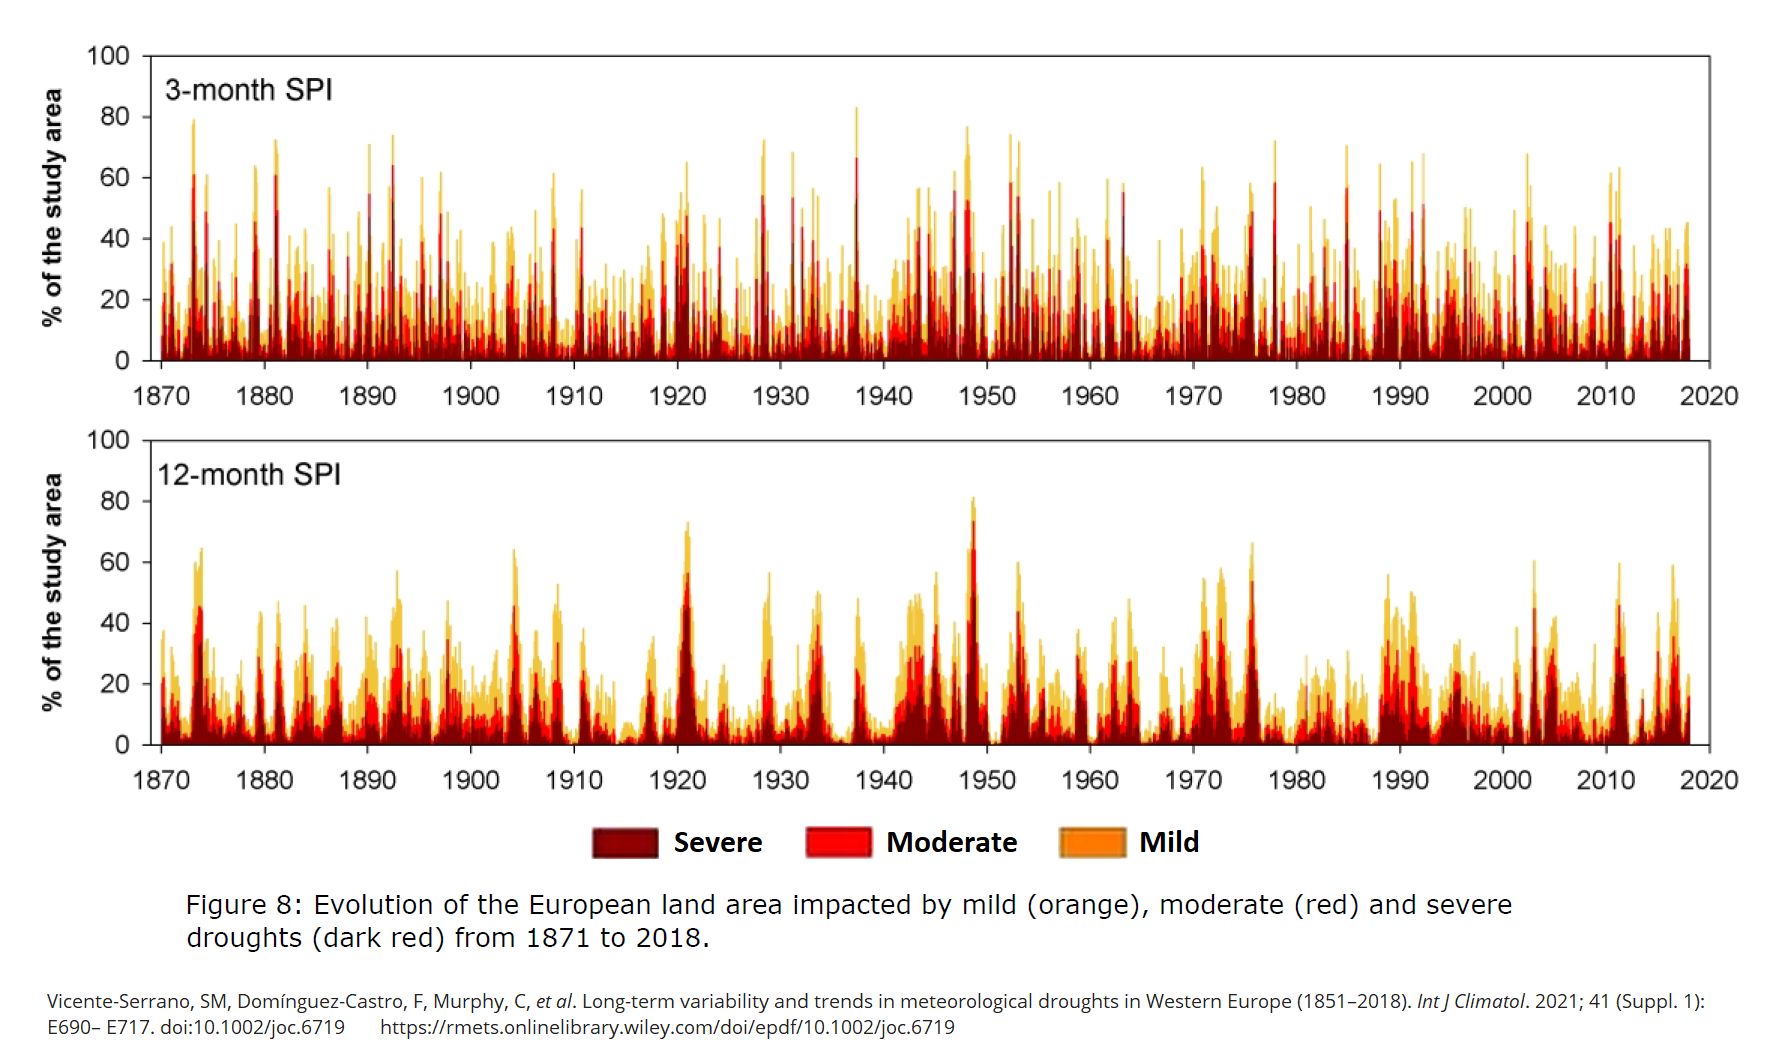
Droughts are not worsening (and drought impacts are decreasing): ↑↑

30. Global integrated drought monitoring and prediction system (and graph).
31. U.S. droughts are not worsening: NOAA NCDC U.S. percentage very wet or very dry (and graph).
32. European droughts are not worsening, either (and graph).
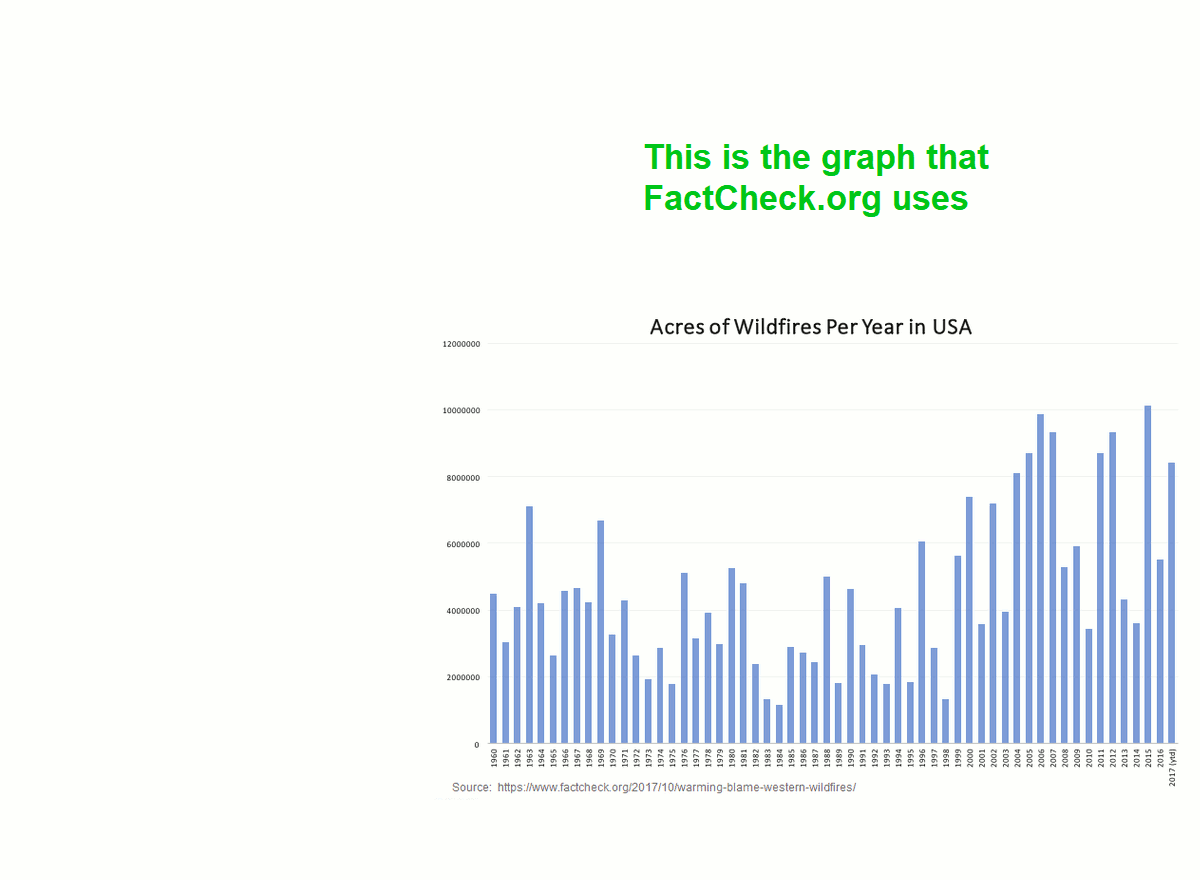
Climate change is not worsening forest fires: ↑

33. The main factors affecting fires are land management and forestry practices.[2]
Contrary to the shockingly dishonest propaganda from some quarters
(like the misnamed factcheck.org site), global warming has negligible impact on wildfires.
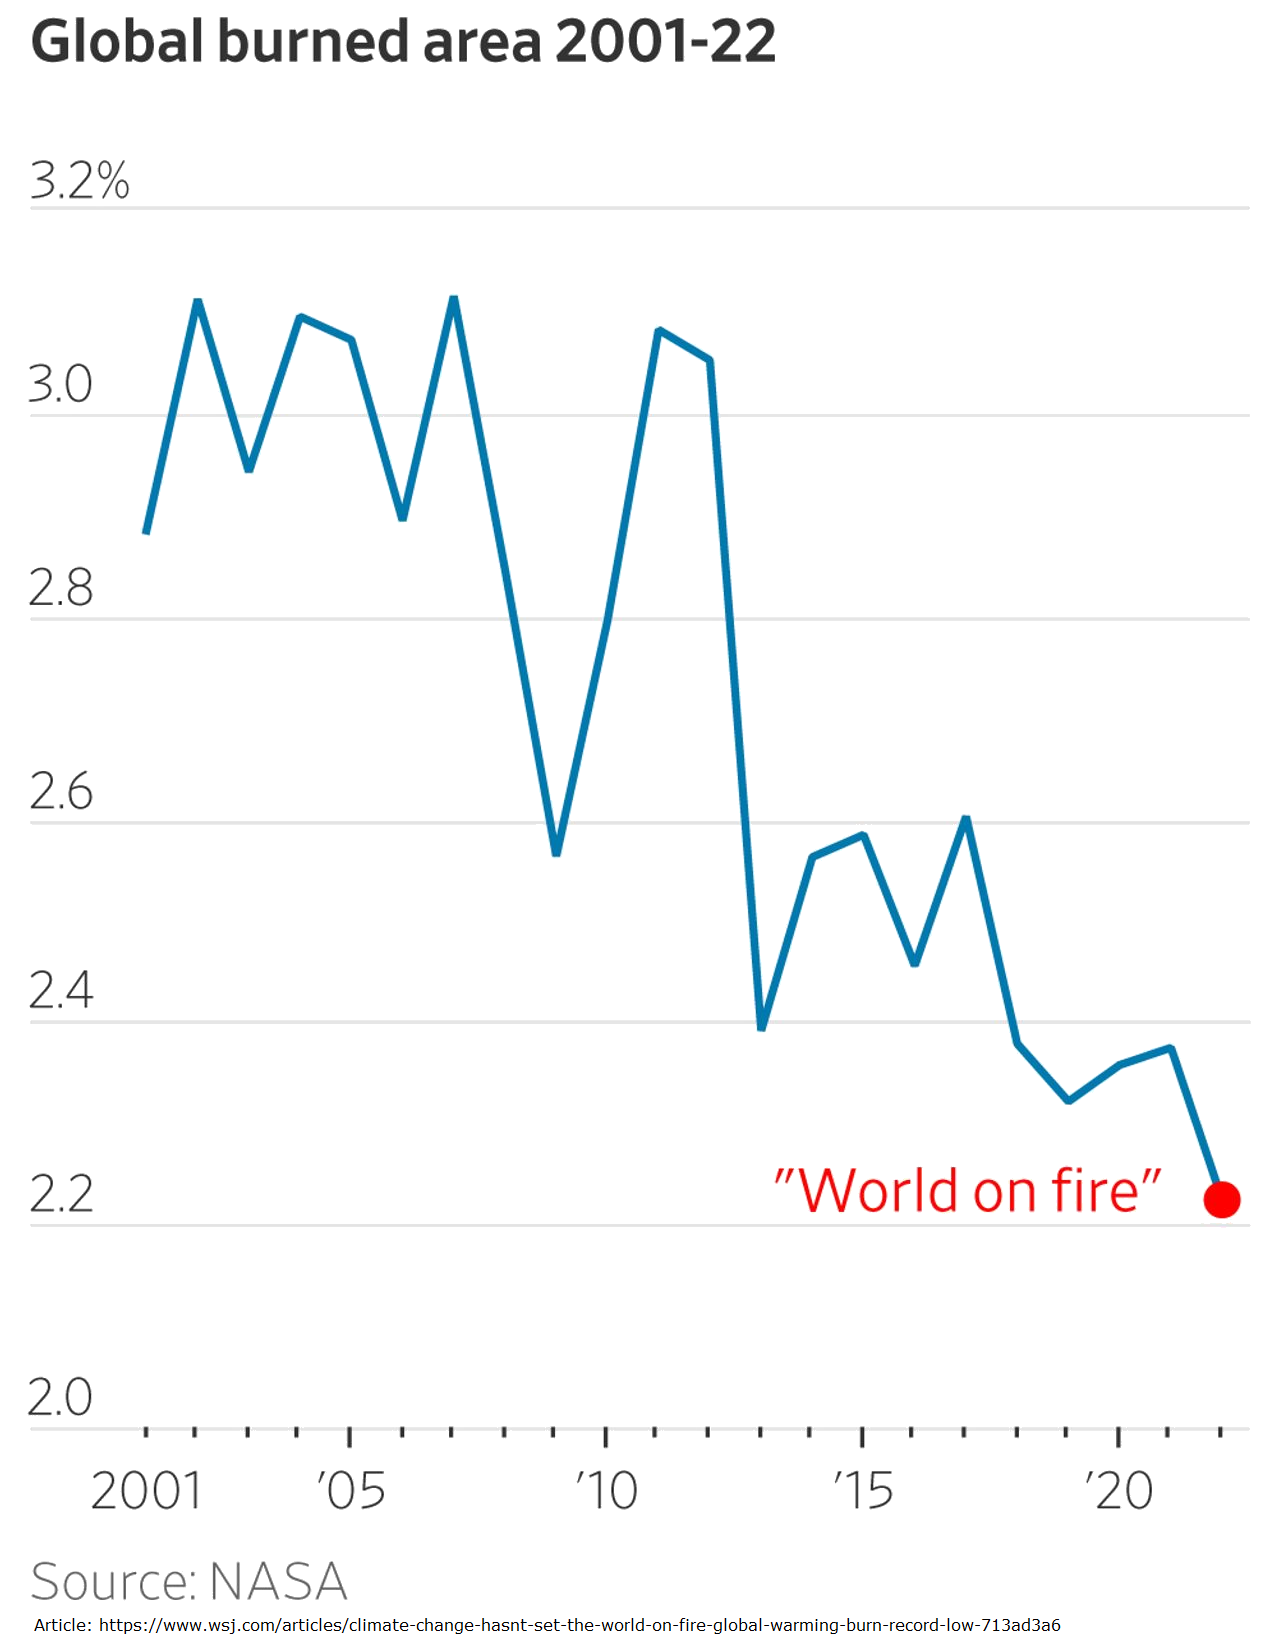
34. NASA satellites monitor fires from orbit, and they've measured a decreasing trend in fires.
NASA reports that,
“...MODIS [satellite instruments have measured] a decrease in the total number of square kilometers burned each year.
Between 2003 and 2019, that number has dropped by roughly 25 percent.” The percentage of the globe which burns each year has
been declining since 2002. In 2022, the world hit a
new record-low of 2.2% burned area.
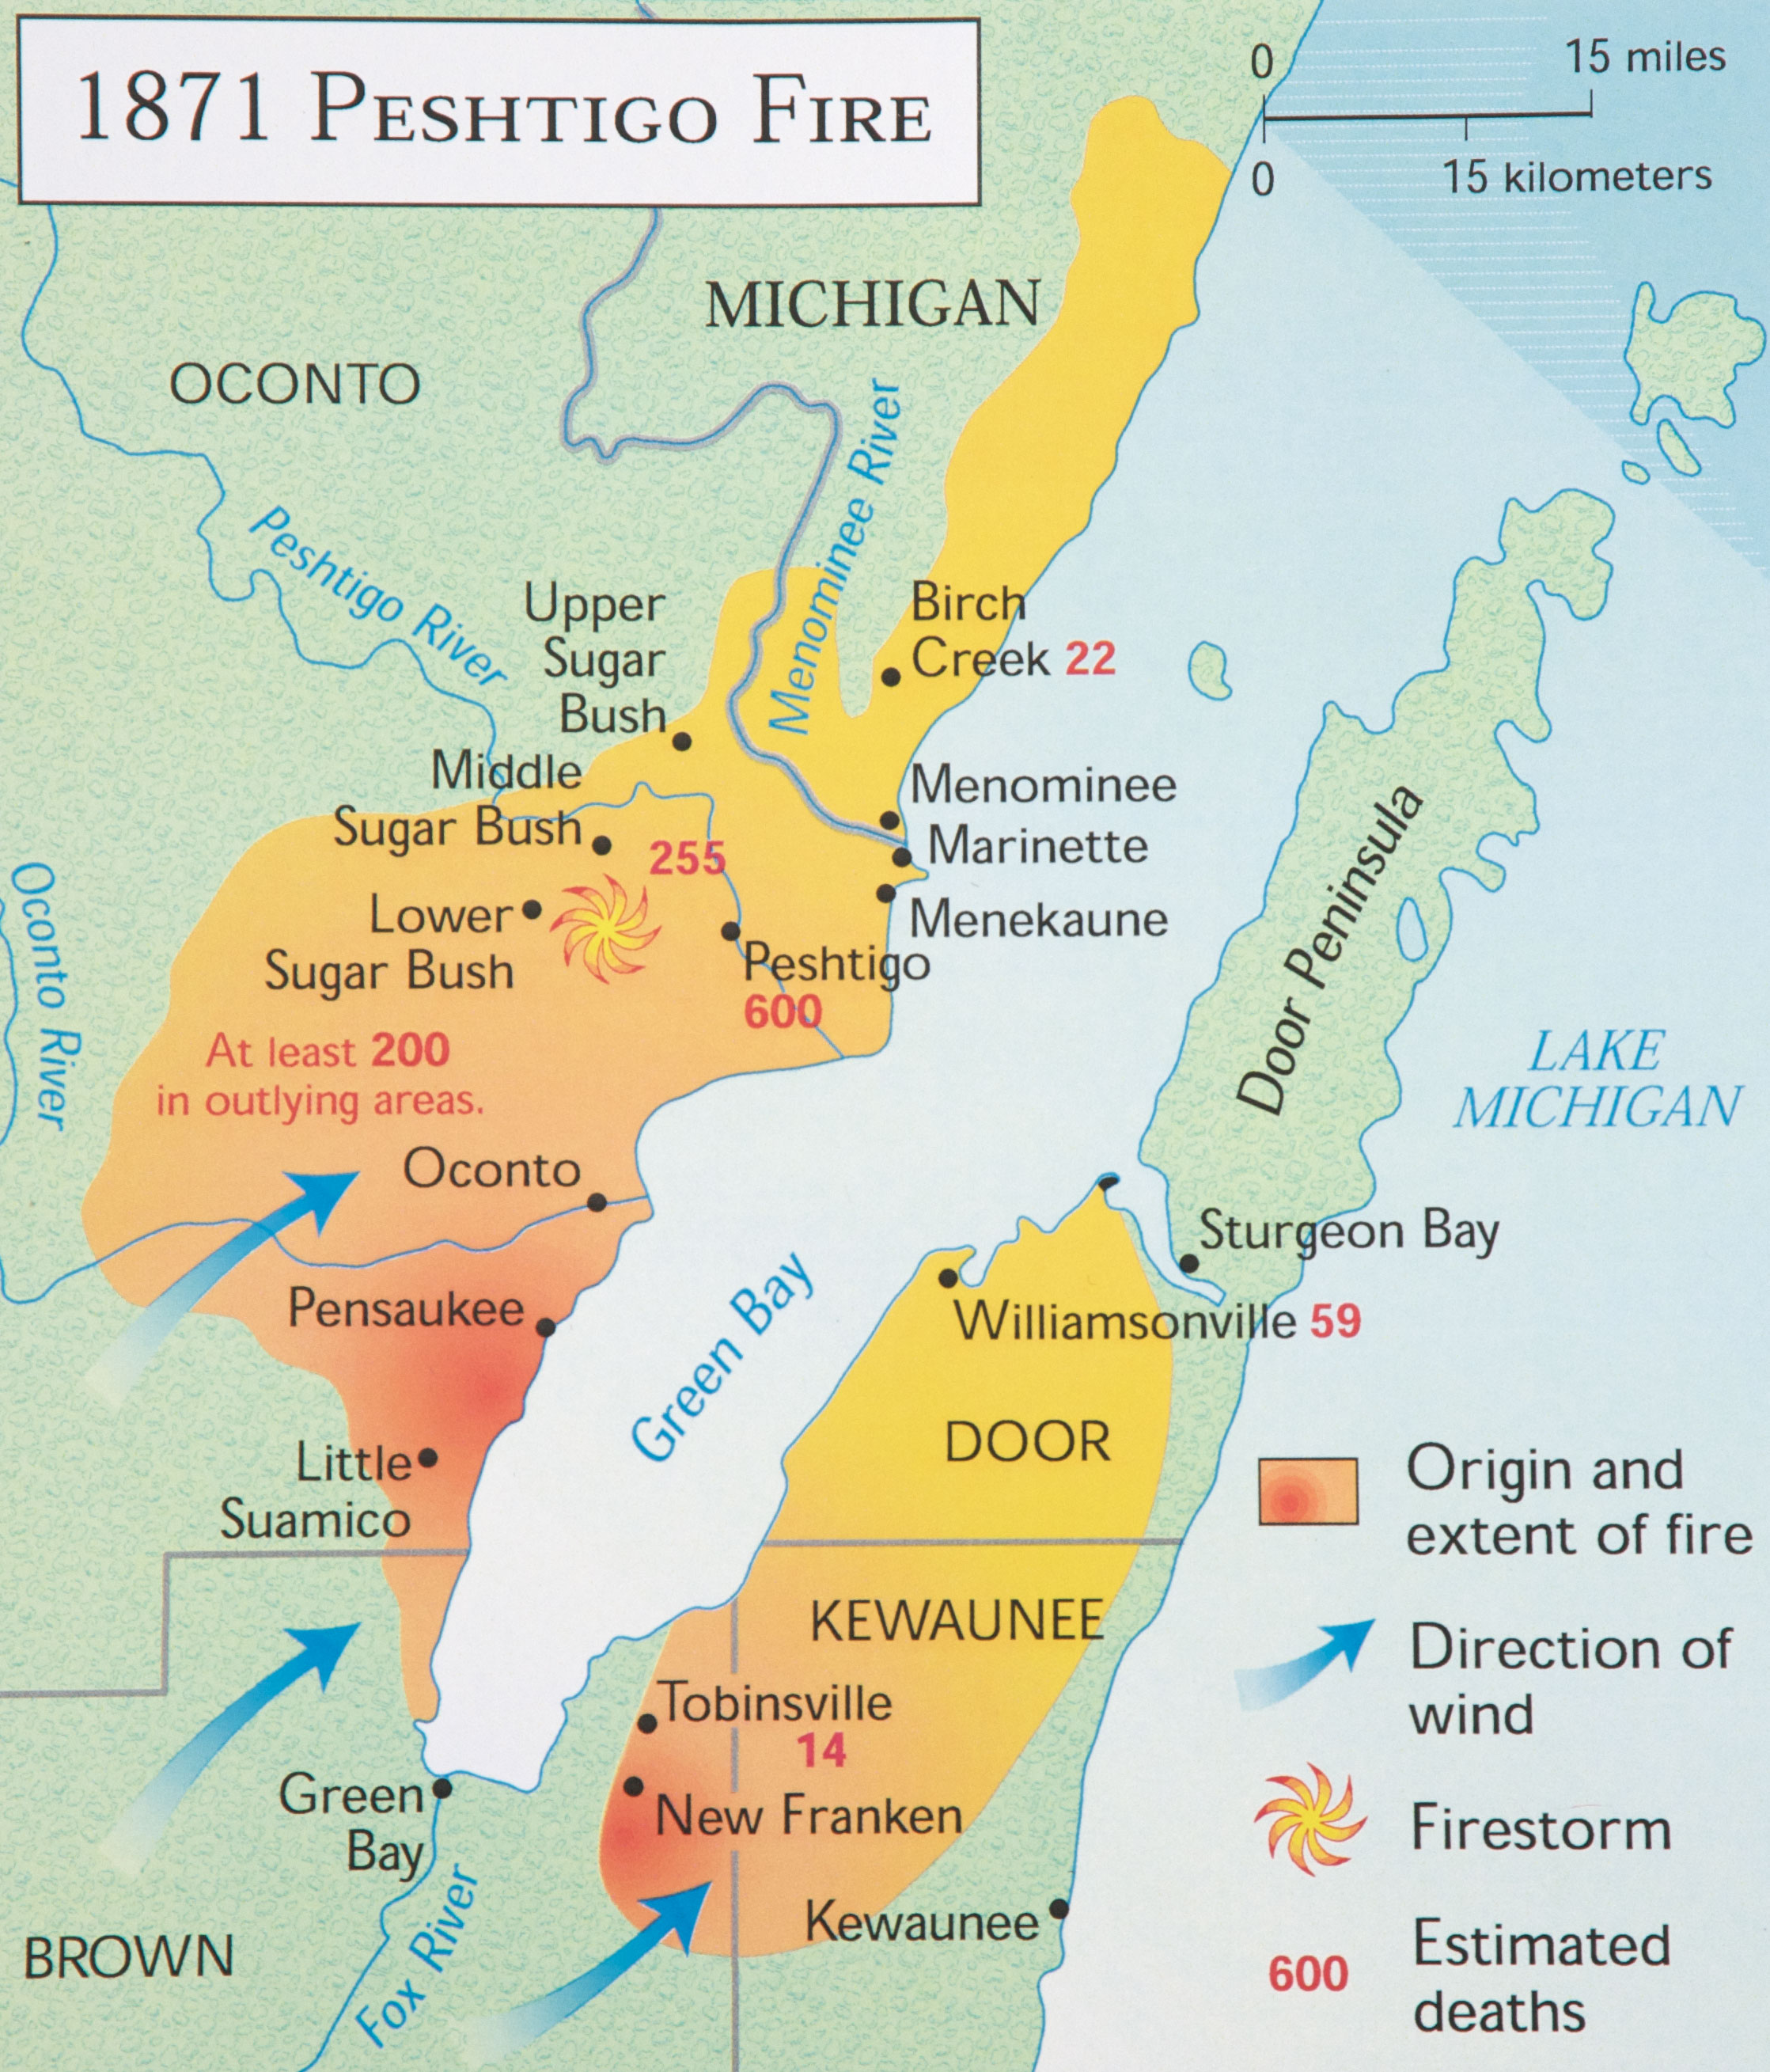
35. If warmer temperatures significantly worsened fire risks, then in the United States forest fires would mostly
occur in the South. But most large U.S.
forest fires have been in the North.
The worst forest fire in American history was
in chilly Wisconsin, in October, 1871,
when CO2 (estimated from ice cores) was only about 288 ppmv. That one fire
consumed
about 1.2 million acres, and it is believed to have killed at least 1200 people. Many of them died of hypothermia, while trying to shelter
from the fire in the frigid Pestigo River.
Current temperatures are not unprecedented: ↑

36. Scientists call warm periods, like the current warm period, “climate optimums.”
Recent warming has not been unusually rapid: ↑↑

37. Depending on which temperature index you choose
(graph source),
global temperatures are believed to have been rising at an average rate of between 0.06°C and 0.16°C per decade since 1958 (the start of
the Mauna Loa CO2 measurement record), as atmospheric CO2 level rose from 315 ppmv to 421 ppmv.
Based on the trends in temperature and CO2 level, we could expect at most a little over 1°C of additional warming by 2100.
That's a small change, and a very slow rate of change, in comparison with past natural changes in the Earth's temperatures.
 We know from ice core isotope analyses that over the last 100,000 years the Earth has experienced dozens of natural
“Dansgaard-Oeschger events”
(a/k/a “Greenland interstadials”)
in which temperatures changed at rates as rapid as several degrees per decade.
(Caveat: The most rapid changes are seen in Greenland ice cores, but
Greenland's temperature changes tend, in general,
to be at least twice as rapid as globally averaged temperature changes, due to “Arctic amplification.”)
We know from ice core isotope analyses that over the last 100,000 years the Earth has experienced dozens of natural
“Dansgaard-Oeschger events”
(a/k/a “Greenland interstadials”)
in which temperatures changed at rates as rapid as several degrees per decade.
(Caveat: The most rapid changes are seen in Greenland ice cores, but
Greenland's temperature changes tend, in general,
to be at least twice as rapid as globally averaged temperature changes, due to “Arctic amplification.”)
What about feedbacks? ↑

38. Dozens of “feedback mechanisms” affect the Earth's climate. Some are “positive” (amplifying),
others are “negative” (attenuating).
What about the claimed “97% consensus”? ↑

39. Q: Is there a 97% consensus
for climate alarmism,
or did over 30,000 scientists say global warming is a hoax?
A: Neither. The best evidence is that manmade climate change is real, but modest and benign.
The only consensus is that emissions of so-called “greenhouse gases” (GHGs)
help warm the Earth. There's no consensus that it's harmful. A warmer climate is generally beneficial, which is why scientists call periods
of warm climate “climate optimums.”
Benefits of rising CO2 levels ↑
The peer-reviewed scientific evidence is compelling that the so-called “social cost of carbon” is negative, meaning
 that CO2 emissions are net-
…for deserts & natural ecosystems:
40. “Greening” the Earth. ↑
…and for agriculture:
41. Carbonic Acid Gas to Fertilize the Air, Scientific American, Nov. 27, 1920. ↑↑

42. The Center for the Study of Carbon Dioxide and Global Change (“CO2
Science”) is a
43. The CO2 Coalition is another
44. The Global Warming Policy Foundation (GWPF) is a UK educational charity and think tank,
with a prestigious Academic Advisory Council, focused
on analysis of climate-related public policies and their economic and environmental implications. They've produced a superb
series of in-depth reports
(like this one on The Good News About Carbon Dioxide),
shorter briefing papers,
reports,
notes and
lectures.
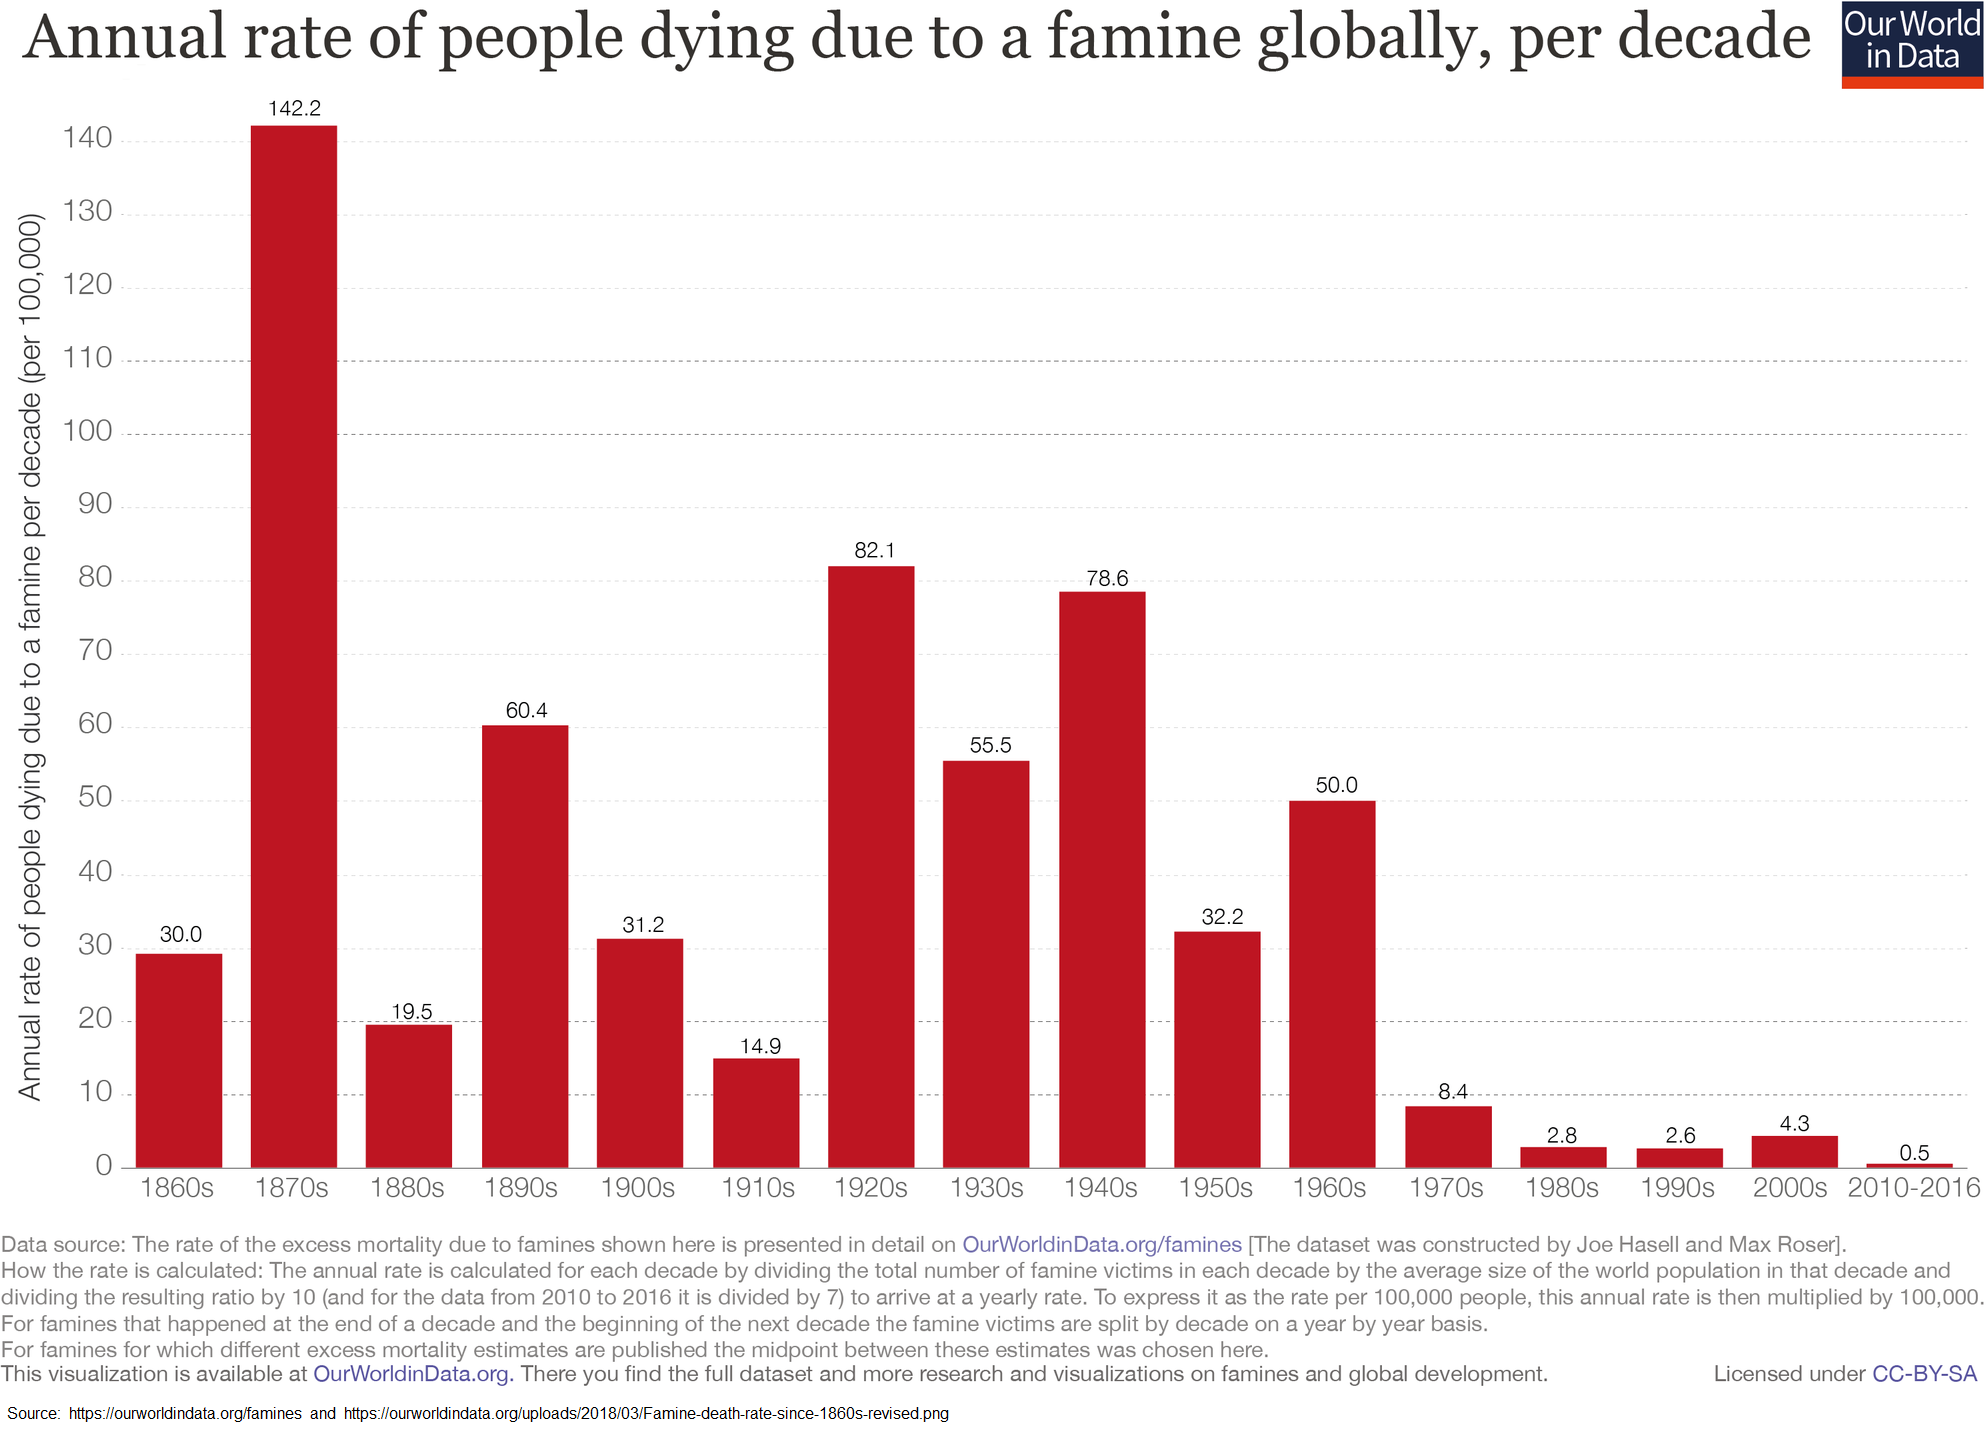
45.
 Increased agricultural productivity and improved drought resilience
due to rising CO2 level are helping to make
famines increasingly rare,
for the first time in human history (see bar chart).
Increased agricultural productivity and improved drought resilience
due to rising CO2 level are helping to make
famines increasingly rare,
for the first time in human history (see bar chart).
46.
 One of the fathers of modern climatology
was the great Swedish scientist and Nobel laureate, Svante Arrhenius. He was the first person to quantify the warming effect of mankind's
CO2 emissions, and he correctly predicted that it would benefit agriculture. He even predicted what is now called
“polar amplification.”
One of the fathers of modern climatology
was the great Swedish scientist and Nobel laureate, Svante Arrhenius. He was the first person to quantify the warming effect of mankind's
CO2 emissions, and he correctly predicted that it would benefit agriculture. He even predicted what is now called
“polar amplification.”
Ten top climate blogs:† ↑

…For news, analysis & discussion:
47. Watts Up With That (“WUWT”), by Anthony Watts.
…For in-depth analysis: (realist/skeptical/lukewarmist/moderate)
48. Climate Etc. by Judith Curry.
49. Roy Spencer.
50. Climate Audit, by Steve McIntyre.
51. Andy May.
52. Jo Nova.
…and, for balance, the four best alarmist blogs:
53. Moyhu, by Nick Stokes.
54. Science of Doom, by Steve Carson.
55. All Models Are Wrong (but some are useful), by Tamsin Edwards.
56. Protons for Breakfast, by Michael de Podesta.
†Note: blogs which are censored to suppress dissent are not listed. (I don't take issue with
enforcement of civility.) That unfortunately includes several prominent alarmist blogs. That's why
I could only find four alarmist blogs to recommend. If you know of any other reasonably good quality alarmist climate blogs, which are not censored to suppress
dissent, please tell me about them. ↑
57. Want more? I also maintain a long list of climate blogs and other useful sites,
and I've written many Quora Answers on climate change
(including one which is similar to this web page).
I can also enthusiastically recommend Heartland Institute's
Climate At A Glance web site. ↑
https://sealevel.info/contact.html
SeaLevel.info
Twitter/Facebook card:
(To switch between Twitter/Facebook cards, click a different “↑” link.)
Permalinks:
🔗https://sealevel.info/learnmore.html
🔗https://sealevel.info/learnmore
🔗https://tinyurl.com/learnmore4
🔗https://t.co/bDDNCzj9VC
🔗https://twitter.com/ncdave4life/status/1432810945017962505
Last modified: 08-Jun-2026 (version 103)
Note: the “last modified” date and version number on this web page are
maintained automatically by TLIB Version Control.