
Climate sensitivity calculations
“Climate Sensitivity” is a measure of the (in)stability of the Earth's temperatures, most commonly defined as the globally averaged temperature increase to be expected from a doubling of atmospheric carbon dioxide (e.g., an increase from 300 ppmv to 600 ppmv). (See also TCR and ECS.)
The most straightforward and obvious way of estimating climate sensitivity to a doubling of CO2 is by examining the result of the “experiment” which we've performed on the Earth's climate, by raising the atmospheric CO2 level from about 311 ppmv in 1950 (or 285 ppmv in 1850) to about 408 ppmv in 2018. We simply examine what happened to temperatures when the atmospheric CO2 level was raised by 31% (or 43%), and extrapolate from those observations.
However, there are a few pitfalls with that approach. For one thing, natural global temperatures variations due to ENSO can be larger than the “signal” we're looking for, so it is important that we choose an analysis interval which avoids those distortions. For another, it would be a mistake to assume that all of the warming which the Earth has experienced since pre-industrial conditions was due to anthropogenic CO2, because much of that warming occurred when CO2 levels were still very low, and because we know of other factors which must have contributed to warming, such as rising levels of other GHGs, and probably aerosol/particulate pollution abatement.
So the key question is, how much of the warming can be attributed to rising CO2 level? In the calculations below, the assumed answer to that question is an explicit parameter, “A” (for “Attribution”).
You can calculate an estimate of TCR sensitivity, using the time period and temperature index of your choice, as follows:
T1 = initial global average temperature (or temperature anomaly) for your chosen time period
T2 = final global average temperature (or temperature anomaly)
C1 = initial CO2 (or CO2e) value
C2 = final CO2 (or CO2e) value
S = sensitivity in °C / doubling of CO2
The formula is very simple:
S = A × (T2-T1) / (log2(C2/C1))
For example, to capture most of the period of rapid CO2 level increases, while avoiding distortions from major ENSO spikes, we could use the period 1960-2014: (click on the graphs to enlarge them)


Over that period, CO2 level rose from about 317 ppmv in 1960 to about 399 in 2014. Depending on which temperature index you trust, temperatures rose by about 0.5 °C (HADCRUT3) or about 0.75 °C (GISS), or somewhere in-between (or even less, according to the satellite-based lower troposphere temperature measurements). Let's use the midpoint of the surface indices, 0.625 °C:

If T1 is 0.00, T2 is 0.625, C1 is 317 (in 1960), C2 is 399 (in 2015), and A is 50%, then:
Note #1: ECS is usually estimated to be about 1½ × TCR.
See: http://sealevel.info/glossary.html#ecs
Note #2: the above discussion doesn't mention minor GHGs like O3, CH4, N2O & CFCs. To take them into account, there are two simple approaches you can use. One is to substitute estimates of “CO2e” (CO2 equivalent) for C1 and C2. The other is to adjust A to account for the fact that some portion of the warming (perhaps one-fourth) is due to other GHGs.
Other than that, the attribution factor, A, is really just an educated guess, but it is based on expert opinion. The American Meteorological Society frequently surveys meteorologists and asks them what percentage of the last 50 years' warming they attribute to “human activity” (presumably mostly GHGs). This bar chart is from their 2017 survey report: ↑

As you can see, the “average” or “midpoint opinion” of American broadcast meteorologists is that a little over half of the
warming was caused by human activity (presumably mostly by CO2):
So if we attribute 57% of the warming to anthropogenic causes, and 75% of that to CO2, the attribution factor, A, should be 0.75 × 0.57 = 0.43 (43%), resulting in a calculated TCR sensitivity estimate of 0.81 °C per doubling of CO2.
Note that our calculation includes the effects of both positive and negative temperature feedbacks.
For ECS, multiply TCR by 1.5, yielding 1.21 °C per doubling of CO2.
The ECS/TCR ratio is sometimes estimated as high as 1.65:1. If we use that multiplier we could get the ECS estimate up to 1.34 °C per doubling of CO2, which is still slightly below the IPCC's “low end” estimate of 1.5 °C per doubling.
On the other hand, if the ECS/TCR ratio is only 1.25:1, then ECS = 1.25 × TCR = 1.01 °C per doubling.
Even if 100% (rather than 57%) of the warming since 1960 is attributed to anthropogenic causes (and 75% of that anthropogenic warming is attributed to CO2), TCR still comes out to only 1.41°C per doubling, and ECS = 1.5 × TCR = 2.12°C.
It is very difficult to approach the IPCC's “midrange” ECS estimate of 3°C per doubling, or the CMIP5 models' average assumption of 3.2°C per doubling, using this sort of analysis.
More resources, and other approaches and results ↑
• Spencer & Christy (2023) used a data-based “1D model” approach and calculated a realistic ECS = 1.9° C, which presumably implies TCS = about 2/3 of that. (The PDF is here, and phys.org has the press release here, and Dr. Spencer blogged about it here.)
• Koll & Cronin (2018) report that, with feedbacks, under clear sky
conditions, the relation between surface temperature and outgoing longwave radiation is (surprisingly!) approximately linear, and
about
• Atmospheric physicist Richard Lindzen's 2022 white paper on this topic
concludes that climate sensitivity in excess 1.5°C is very
• Bates 2016 used satellite
measurements, and calculated an ECS (EfCS)
• Barrett (archived here, and mostly circa 2011, archived here) calculates a TCR sensitivity of 1.84 ±0.11 °C, if all warming was due to known anthropogenic forcings. (To the extent that the 20th century's warming was natural, or due to unaccounted for anthropogenic forcings, the TCR sensitivity would be lower.) ↑
• Lewis & Curry 2016 reported a TCR sensitivity of 1.34 (0.91–2.44) °C. ↑
• Christy & McNider (2017) (or preprint) attempted to account for volcanic and ENSO distortions (like Santer et al 2014). They measured an underlying rate of climate warming of 0.096°C/decade, and calculated a lower tropospheric TCR climate sensitivity of +1.10 ±0.26 °C per CO2 doubling. The paper is quite long, but here's a readable discussion. ↑
• Nir Shaviv has a good web page on this topic, entitled, On Climate Sensitivity and why it is probably small. ↑
• Way back in 1984, Hansen et al estimated an EqCS sensitivity of 3.0±1.5 °C (see also this paper, the same year). Based mostly on GCMs, the IPCC's AR5 report gives exactly the same estimate. ↑
• Willis Eschenbach used CERES satellite data to determine the warming effect of a 3.7 W/m² forcing, and found it to be less than 0.4°C, which suggests a low climate sensitivity value. ↑
• For another innovative approach to estimating climate sensitivity, which
...and this follow-up:
Note: the effect of GHGs on radiation balance at TOA is similar, but not identical, to the effect at the Earth's surface. Here's a discussion.
• The climate sensitivities “baked into” CMIP5 GCMs vary by factors as high as 2.3-to-1, but average about 3.2°C (ECS) and 1.8°C (TCR). (Unsurprisingly, the models run hot [or here].) ↑
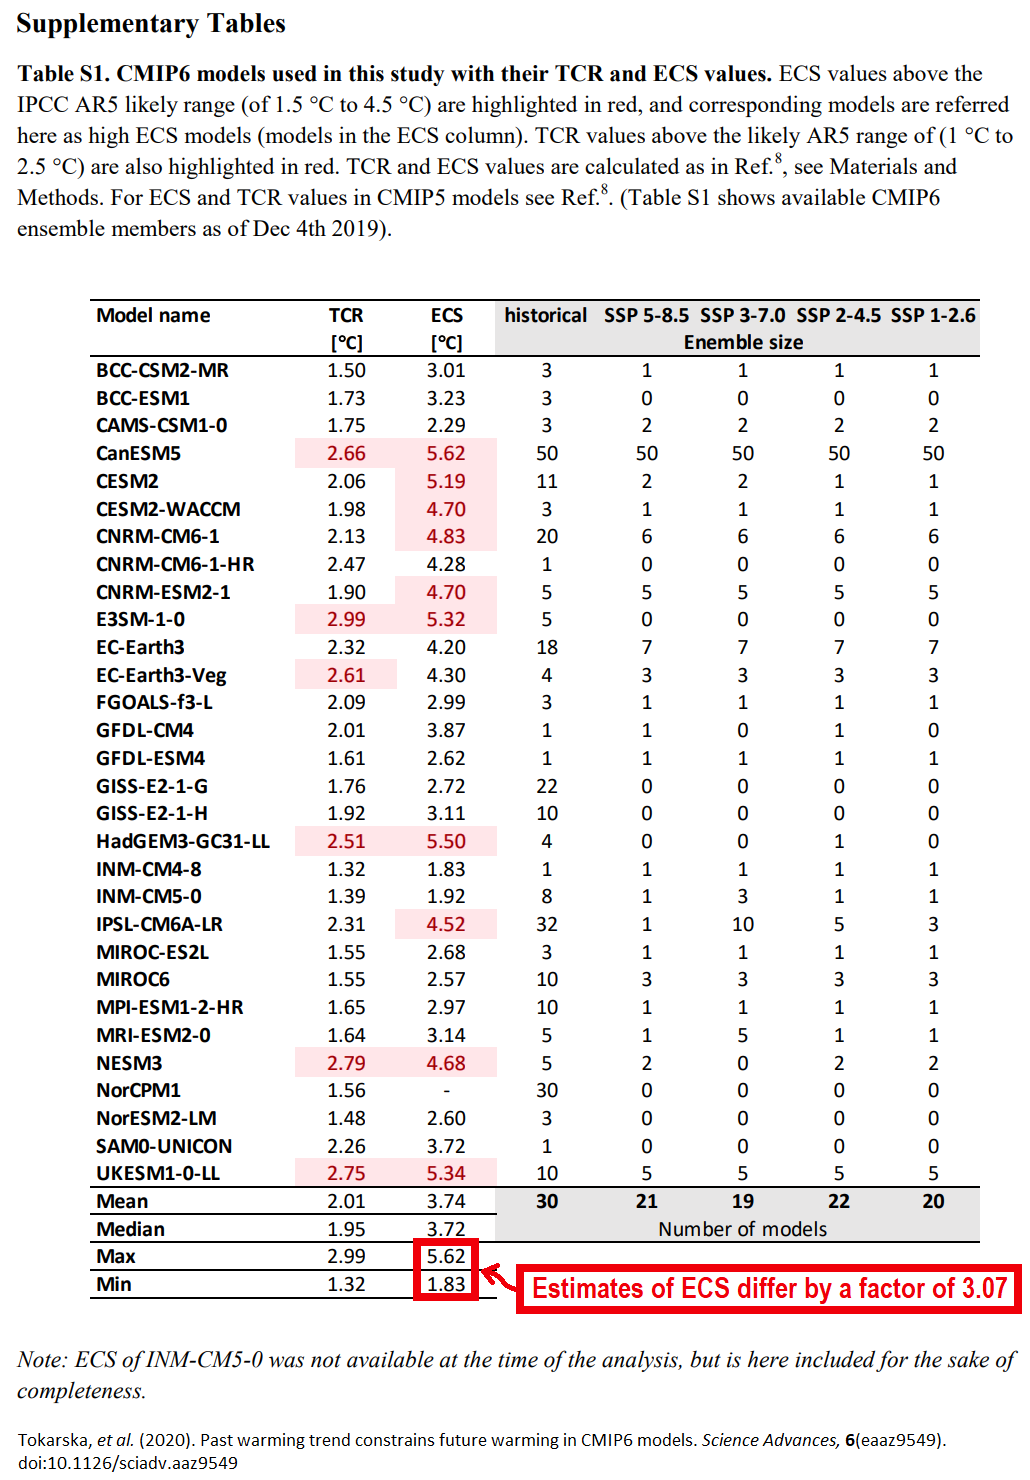
• The climate sensitivities baked into CMIP6 GCMs vary by more than 3-to-1, but average about 3.7°C (ECS) and 2°C (TCR). ↑
• In 2014, the American Physical Society held a balanced panel discussion, with experts on each side of the climate debate, which included a discussion of climate sensitivity. The APS has the transcript on their web site (or here). (I wrote to them in 2019, 2020, 2021, 2022, 2023 & 2024, asking for a copy of the recording of the event; on 11/14/2024 they replied, "I have consulted our Meetings dept and have been told that we do not have a recording of this workshop.") ↑
• BerkeleyEarth reports measurements indicating that ECS is below 2.0°C (see tweet 1 of 11 or compiled tweetstorm), though they won't admit it!
• The go-to sources for climate activists seeking peer-reviewed justification for high
• Lewis, N. (2023) debunks Sherwood et al 2020. Here are a couple of related articles: [1], [2]. ↑
• Knutti, et al 2017 (pdf) usefully summarizes conclusions from over seventy papers, and notes the disparity between climate models and measurements:
“A striking feature of Figs 2 and 3 is that evidence from climate modelling favours values of ECS in the upper part of the likely range, whereas many recent studies based on instrumentally recorded warming… favour values in the lower part of the range.”
My quibble with that statement is that “evidence from climate modelling” is not actually evidence of anything, except of the assumptions baked into climate models. The divergence between GCMs and measured reality simply reflects the failure of the former to correctly model the latter.
That's not surprising, because the climate modelers clearly do not understand what they're trying to model, a fact which is proven by the huge variation between the models' assumptions about basic climate parameters. ↑
• Climate sensitivity estimates in the scientific literature vary wildly, but (other than Knutti & Sherwood) they have mostly been declining, slightly, as discussed on the sealevel.info Resources page.
• Additional resources related to this topic can be found here:
https://www.sealevel.info/resources.html#sensitivity
• Twitter card (click to enlarge):
SeaLevel.info