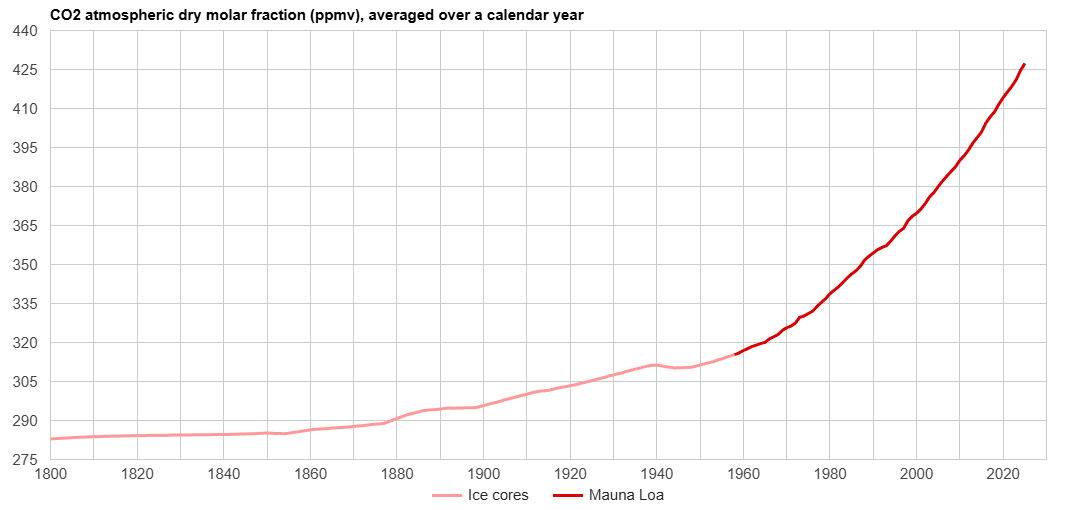
Atmospheric Carbon Dioxide (CO2) levels, 1800–present
Warning: javascript is disabled, so options and interactive features are unavailable.
Warning! Javascript is disabled, or your web browser is incompatible with Google Charts, so this page won't display correctly. Try Google Chrome, Opera, MS Edge, Brave, Vivaldi, Pale Moon, Maxthon, Midori or Mozilla Firefox.
All of the CO2 figures are annual averages.
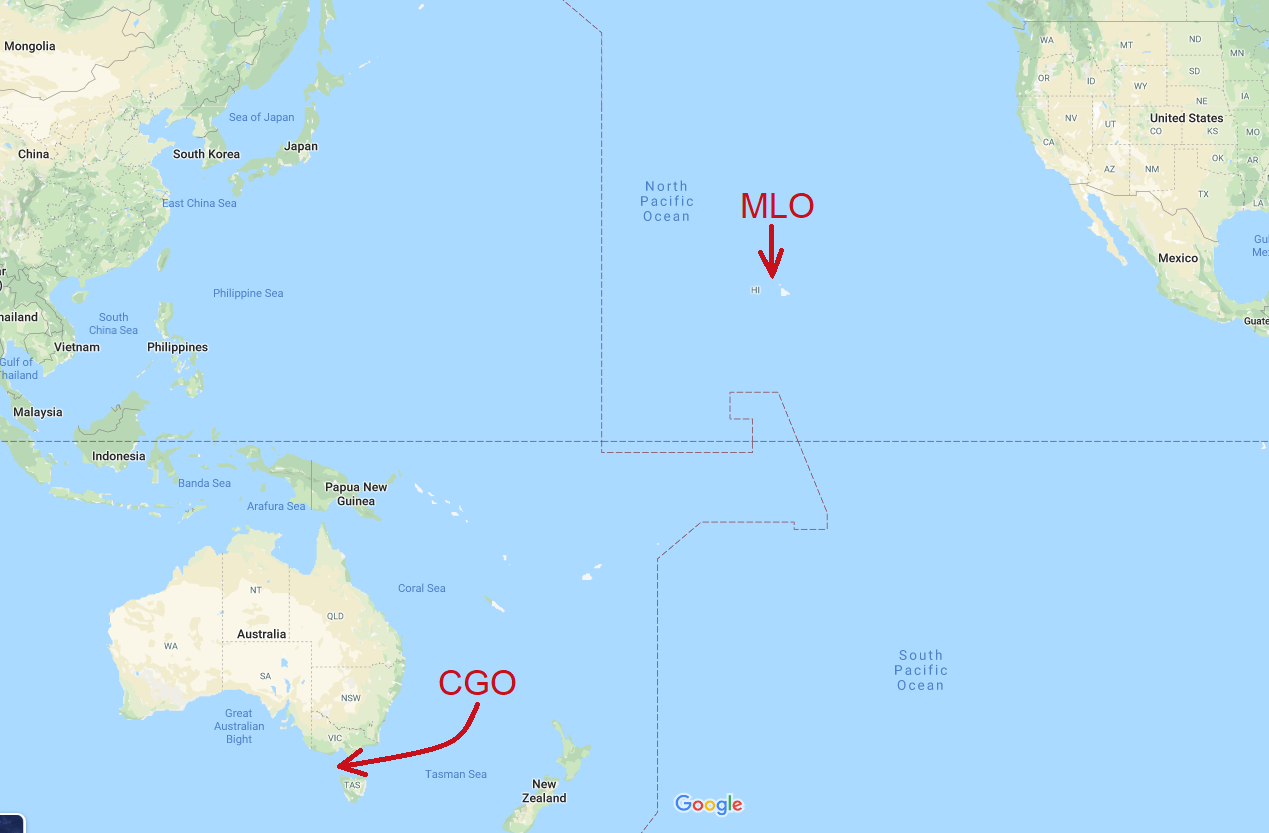
We use Mauna Loa Observatory data because it has the longest high-quality measurement record. But CO2 levels are also measured in other places, such as Cape Grim[2], Tasmania (“CGO”), where CO2 levels average about 4 ppmv lower [spreadsheet], and the seasonal cycle is very different.
(or take a screenshot with PrtScn or the Windows Snipping Tool).
The CO2 level for the final year is a preliminary projection, estimated based on partial-year data from the “de-seasonalized” column of NOAA's MLO monthly CO2 data.
We also have a similar graph for methane (CH4), and a combined graph with both CO2 and CH4.
For how to convert between ppmv CO2 and other units, like PgC or Gt CO2, see the conversion factors.
Direct measurements of CO2 at Mauna Loa Observatory (“MLO”) in Hawaii began in March, 1958. That's the annual average CO2 concentration data graphed here for 1959 – 2025, downloaded from:
https://gml.noaa.gov/webdata/ccgg/trends/co2/co2_annmean_mlo.txt
Global average CO2 levels average 1.5 to 2 ppmv lower than MLO for recent years: https://gml.noaa.gov/webdata/ccgg/trends/co2/co2_annmean_gl.txt
NOAA's MLO monthly CO2 data can be downloaded here: https://gml.noaa.gov/webdata/ccgg/trends/co2/co2_mm_mlo.txt. (You can also download the MLO monthly CO2 data in .json format here, or in .csv format here; it might be a day or two out-of-date.)
1850-1958 data is from http://data.giss.nasa.gov/modelforce/ghgases/Fig1A.ext.txt (ice cores).
1800-1850 CO2 data is from https://www.ncdc.noaa.gov/pub/data/paleo/icecore/antarctica/law/law_co2.txt (Law Dome ice cores, 75 year smoothed; it also estimates CO2 in 1780 as ≈280 ppmv, and CO2 in 1750 as ≈277 ppmv). There are also CO2 records going back further, though with lower temporal resolution, from sites with slower ice accumulation rates: Vostok, Siple, EPICA Dome C, WAIS Divide, and composite.
For a deeper dive into CO2 measurements from Antarctic and Greenland ice cores, I recommend these two
articles by geologist Renee Hannon:
1. Hannon, R. (2024) Measurement
of CO2 Concentrations Through Time Using Ice Core and Stomatal Proxy Data. CO2 Coalition.
2. Hannon, R. (2021) Greenland Ice Core CO2
during the past 1,000 years. Andy May Petrophysicist (blog).
Historical “carbon budget” information, about sources, sinks & fluxes of CO2 since 1750, can be found in these spreadsheets, as well as from the Integrated Carbon Observation System (ICOS), and from ourworldindata (search the downloaded data file for “world”).
SeaLevel.info
Last modified: 28-May-2026 (version 75)