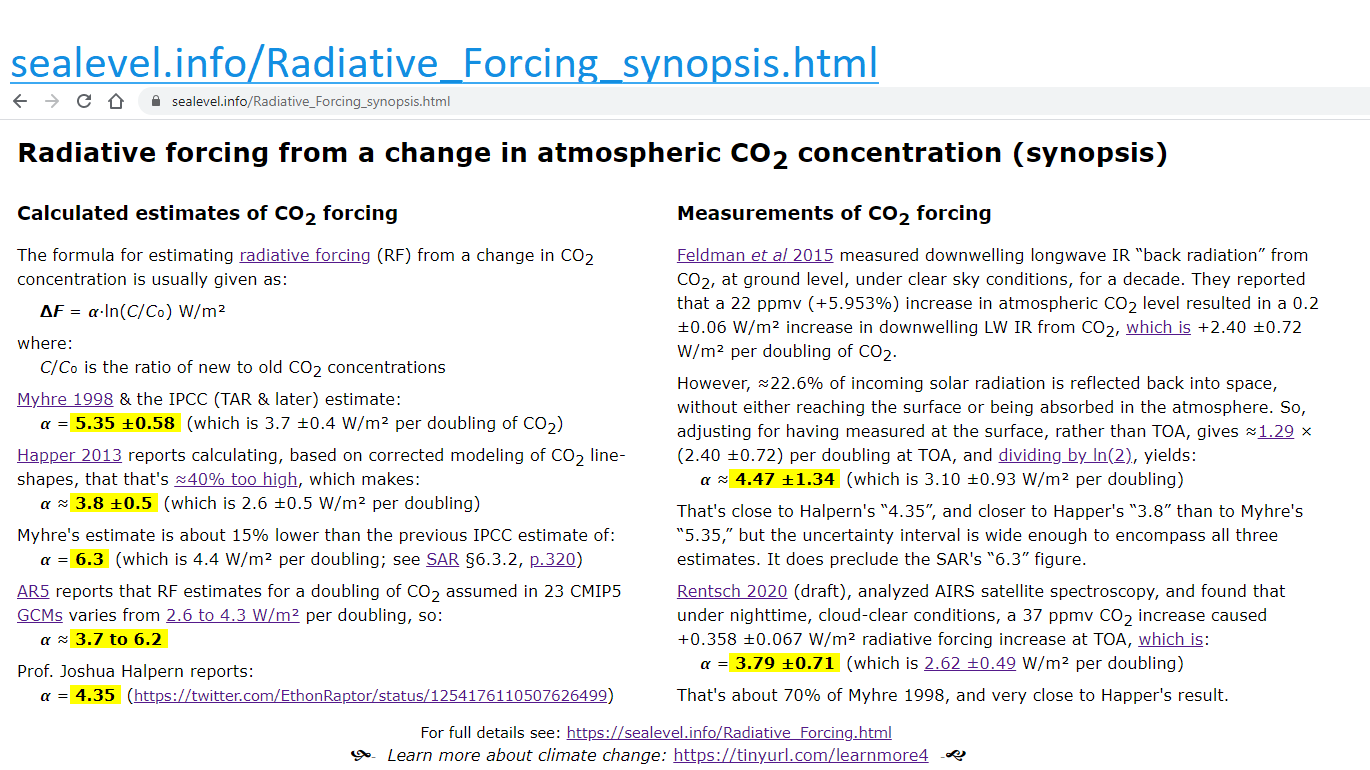
The formula for estimating radiative forcing (RF or ΔF) from a change in atmospheric CO2 concentration is usually given as:
C/C₀ is the ratio of new to old CO2 concentrations
For the RF from a doubling of CO2, set C/C₀ = 2, so RF = 𝞪⋅ln(2) W/m². Conversely, if you're given the RF from a doubling of CO2, 𝞪 = RF/ln(2).
Myhre 1998 and the IPCC
(TAR & later) estimate:
𝞪 = 5.35 ±0.58
(which is
3.7 ±0.4 W/m² per doubling of CO2)
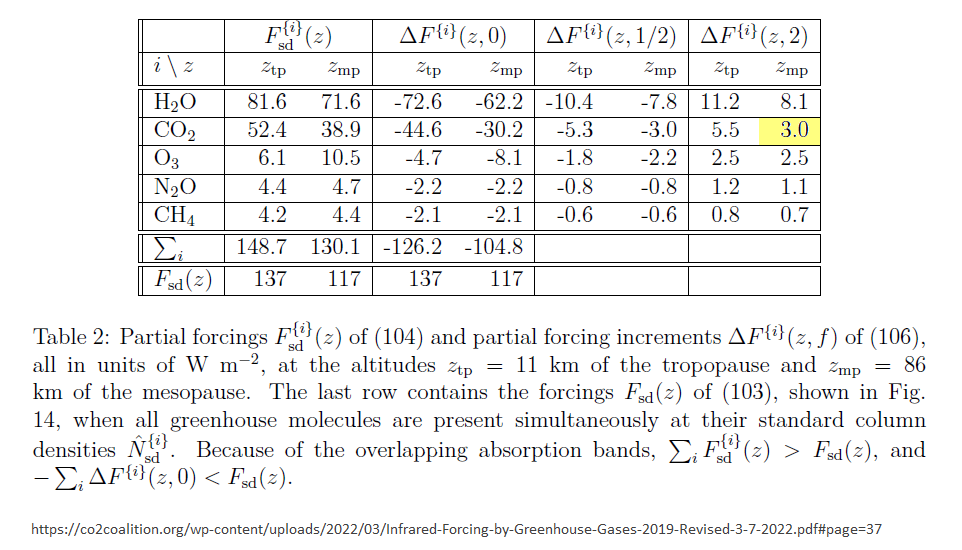
van Wijngaarden & Happer 2022
(preprint) (see also 2020 &
2021,
and earlier Happer 2013a, 2013b, 2014 & 2015)
calculated ERF at the mesopause (similar to TOA) from doubling CO2 to be:
𝞪 ≈ 4.33 (which is 3.0 W/m² per doubling)
Myhre's estimate is about 15% lower than the previous IPCC estimate of:
𝞪 ≈ 6.3 (which is 4.4 W/m² per doubling; see
FAR p.52 &
SAR p.320)
AR5 reports that RF estimates for a doubling of CO2 assumed in 23 CMIP5 GCMs vary
from 2.6 to 4.3 W/m² per doubling, so:
𝞪 = 3.7 to 6.2
Prof. Joshua Halpern (apparently unpublished) reports:
𝞪 ≈ 4.35 (https://x.com/EthonRaptor/status/1254176110507626499)
Feldman et al 2015 measured downwelling longwave IR “back radiation” from CO2,
at ground level, under clear sky conditions, for a decade. They reported that a 22 ppmv (= +5.946%)
increase in atmospheric CO2 level (+8.333% forcing) resulted in a 0.2 ±0.06 W/m² increase in downwelling LW IR from CO2,
which is +2.40 ±0.72 W/m² per CO2 doubling.
𝞪 = 4.47 ±1.34 (which is 3.10 ±0.93 W/m² per doubling)
Rentsch 2020 (preprint), analyzed AIRS satellite spectroscopy, and found that under nighttime, cloud-clear conditions, a 37 ppmv CO2 increase
caused +0.358 ±0.067 W/m² radiative forcing increase at TOA, which is:
𝞪 = 3.79 ±0.71 (which is 2.62 ±0.49 W/m² per doubling)
Kramer et al 2021.
Observational evidence of increasing global radiative forcing. GRL, 48, e2020GL091585.
doi:10.1029/2020GL091585.
(Suggests a low RF similar to van Wijngaarden & Happer; see discussion.)
For more details see: https://sealevel.info/Radiative_Forcing.html
For effect on temperatures see: https://sealevel.info/sensitivity.html
For similar calculations for CH4 see: https://sealevel.info/methane.html
For graphs of atmospheric CO2 concentration see: https://sealevel.info/co2.html
For CO2 emissions data see: https://sealevel.info/carbon/
Twitter card