Radiative Forcing from a change in atmospheric CO2 concentration
By Dave Burton, Oct. 11, 2020.
(Adapted, in part, from a blog comment.)
Last updated: Jan. 1, 2024.
• Synopsis: https://sealevel.info/Radiative_Forcing_synopsis.html
• Similar calculations for CH4: https://sealevel.info/methane.html
Contents:
1. Calculated estimates of CO2's radiative forcing
2. Measurements of CO2's radiative forcing
2.1 Feldman, 2015
2.2 Rentsch, 2020
2.3 Kramer, 2021
3. Warming effect of radiative forcing
1. Calculated estimates of CO2 forcing
The formula for estimating radiative forcing (RF) from
a change in atmospheric CO2 concentration is usually given as:
ΔF = ERF⋅log2(C/C₀) W/m²
C/C₀ is the ratio of new to old CO2 concentrations, and
ERF = 𝞪⋅ln(2) = “Effective Radiative Forcing” per doubling of CO2 level
𝞪 = 5.35 ±0.58
For a doubling of CO2 concentration that yields:
ERF = 𝞪⋅ln(2) = 3.7 ±0.4 W/m² per doubling of CO2 concentration
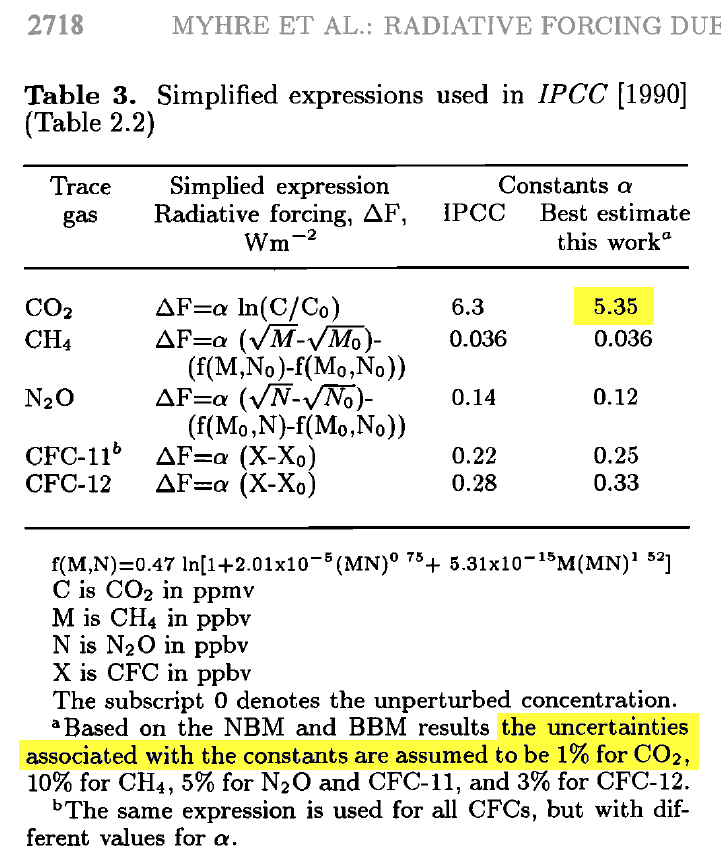
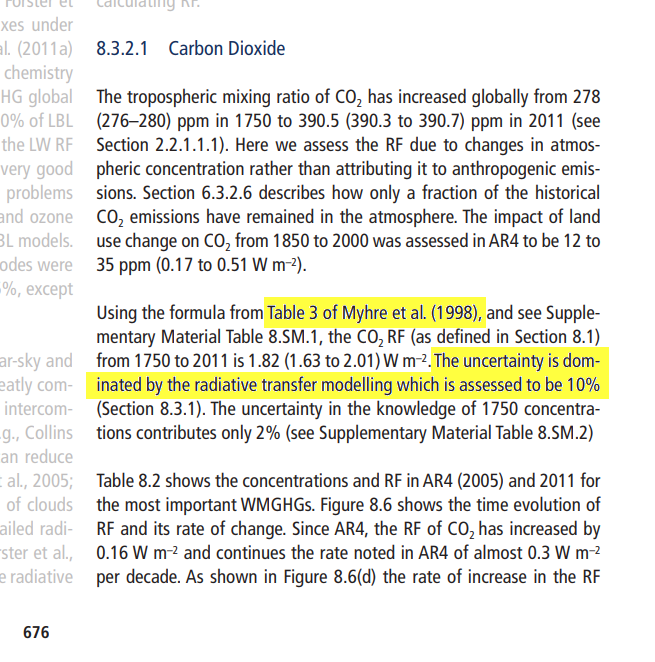
That's the figure mostly used by the IPCC (TAR & later). It is from Myhre 1998 (pdf), though Myhre preposterously claimed an uncertainty of only 1%. The more realistic ±0.4 W/m² confidence interval (per doubling of CO2) is from 'Step 4' of Gavin Schmidt's 2007 RealClimate post. (That would be about ±0.58 for 𝞪.) AR5 gives a similar uncertainty of “10%”.
That represented about a 15% reduction from an earlier
(FAR Table 2.2 p.52, and
SAR §6.3.2 p.320)
IPCC estimate of:
𝞪 = 6.3 (which is ERF=4.4 W/m² per doubling)
Prof. Will Happer (2013) reported calculating [2],
based on corrected modeling of CO2 lineshapes, that Myhre's widely used “5.35” coefficient is about 40% too high.
(See also Happer 2015.)
That makes:
𝞪 ≈ 3.8 ±0.5 (which is 2.6 ±0.5 W/m² per doubling)
Etminan, Myhre, Highwood & Shine (2016) reported a more complex formula which is similar to Myhre (1998), but with 𝞪 very slightly smaller for small CO2 level changes, and 𝞪 slightly larger for large future CO2 level changes; see details here. They claimed a 10% uncertainty.
van Wijngaarden & Happer (2021) (preprint) (and 2020
& 2022)
report calculating CO2's ERF at the mesopause (similar to TOA) to be
2.97 W/m² per doubling (see their Table 2
[or 2020 version,
or 2022 update],
rightmost column). That makes:
𝞪 = 4.28
The IPCC's AR5 reported that the radiative forcing estimates for a doubling of CO2 assumed in 23 CMIP5 GCMs vary
from 2.6 to 4.3 W/m² per doubling, so that:
𝞪 ≈ 3.7 to 6.2
Prof. Joshua Halpern reports:
𝞪 = 4.35 (I don't know his source; I asked, but he didn't answer):
![Joshua Halpern on Twitter: 'CO2 forcing is approximated by 4.35 ln ([CO2(current)]/[CO2(1880)])''](twitter_EthonRaptor_1254176110507626499_screenshot01.png "click to view tweet")
2. Measurements of CO2's radiative forcing
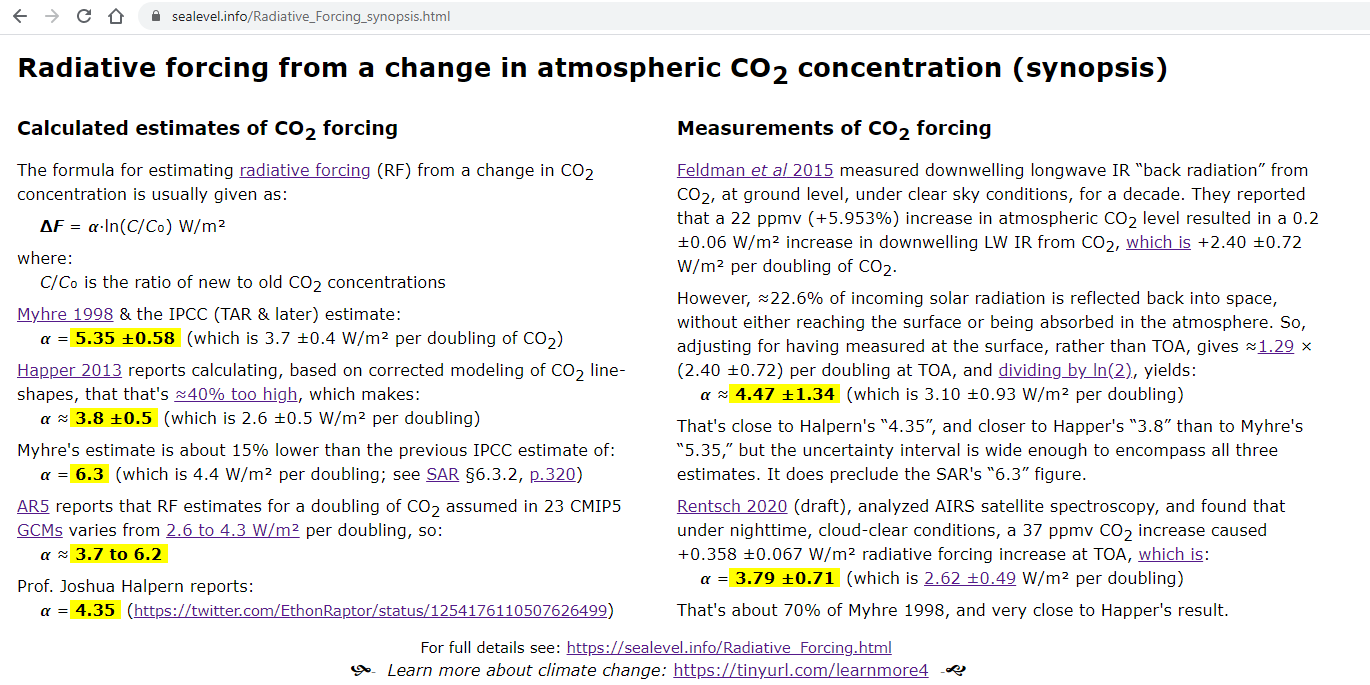
Feldman et al 2015 (preprint here) measured downwelling longwave IR “back radiation” from CO2, at ground level, under clear sky conditions, for jsut over a decade, to determine the effect of increasing atmospheric CO2 concentration. They reported that a 22 ppmv increase (+5.946%, starting from 370 ppmv in 2000) resulted in a 0.2 ±0.06 W/m² increase in downwelling LW IR from CO2. A 5.946% concentration increase yields a 8.333% forcing increase, which happens to be almost exactly 1/12 of a doubling, which makes their measured result 12 × (0.2 ±0.06 W/m²) = +2.40 ±0.72 W/m² per doubling of CO2.
However, radiative forcing is customarily defined at TOA, not at the surface. That is, it's specified in terms of an equivalent change in solar radiation. The effect of GHGs on radiation balance at the surface is similar, but not identical, to their effect at TOA.
The only way that energy leaves the Earth at TOA is by radiation, but at the Earth's surface the energy fluxes are much more complicated, including important mechanisms like convection and evaporative cooling. Warming the Earth causes its rate of cooling to increase by all of those mechanisms, making them negative feedbacks. Those negative feedbacks limit the temperature increase which results from an increase in any forcing.
GHGs in the atmosphere have their effect on temperature by absorbing outbound longwave IR radiation from below, which otherwise would have escaped to space. Absorbing that radiation warms the atmosphere. That, in turn, increases radiation from GHGs in the atmosphere, about half of which goes back down toward the surface, as “downwelling” or “back radiation,” which warms the surface. Hence, the surface and the lower troposphere warm or cool together.
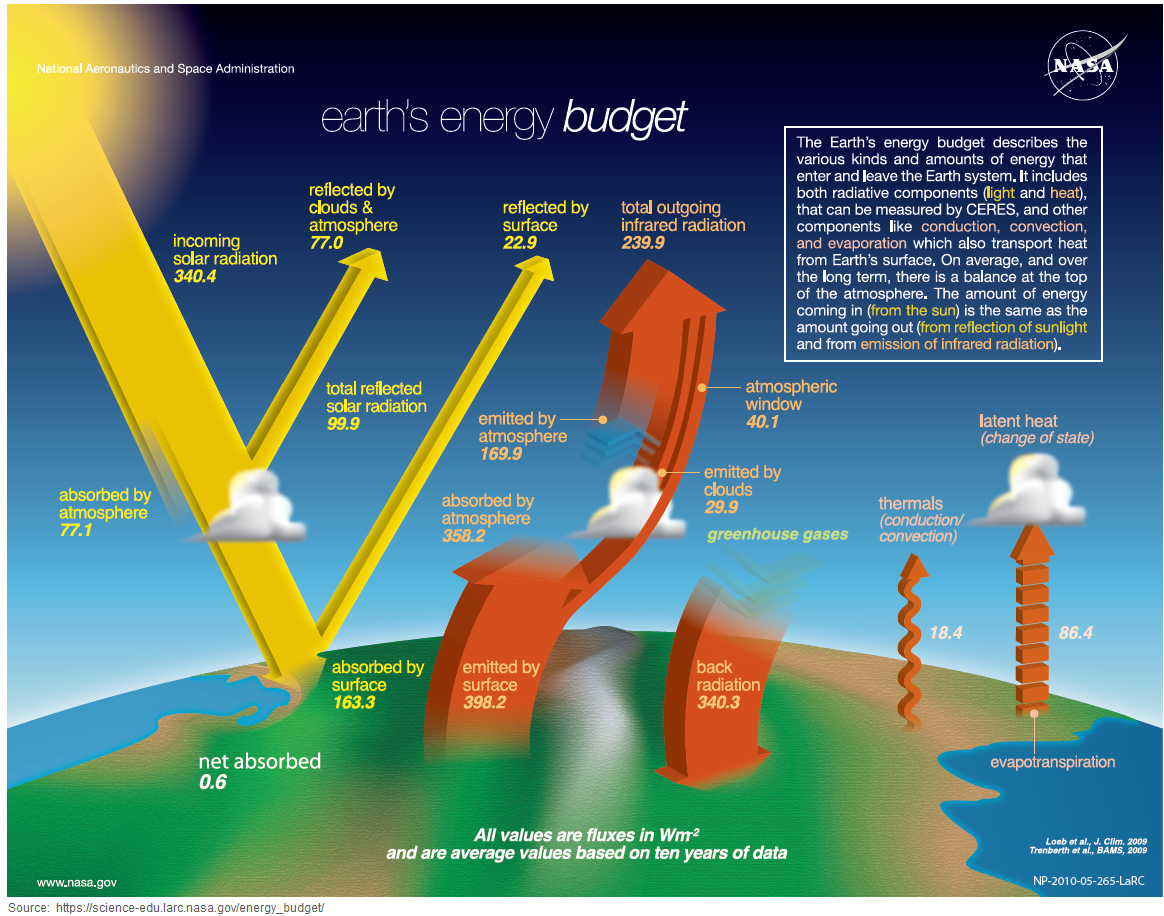
Here's NASA's 2014 version of the famous Trenberth energy flow diagram (click to enlarge it):

The diagram was discussed on WUWT, here:
https://wattsupwiththat.wordpress.com/2014/01/17/nasa-revises-earths-radiation-budget-diminishing-some-of-trenberths-claims-in-the-process/
For comparison with other similar diagrams, both older and newer, see: https://sealevel.info/ERB_diagrams.html
The diagram shows:
1. Incoming solar radiation at TOA = 340.4 W/m². That's one-fourth of 1361.6 W/m², which was their estimate for the average value of the “Solar Constant.” (The so-called “Solar Constant” actually varies somewhat, and other estimates for its average vary from 1360 to 1370 W/m², with recent estimates mostly between 1360 and 1362 W/m².) ↑
It's one-fourth because the 1361.6 W/m² figure is solar radiation intensity at TOA, where the Earth directly faces the Sun, and the 340.4 figure is averaged over the entire globe, including the back side. (The surface area of a sphere is exactly four times the area of a circle of the same radius.)
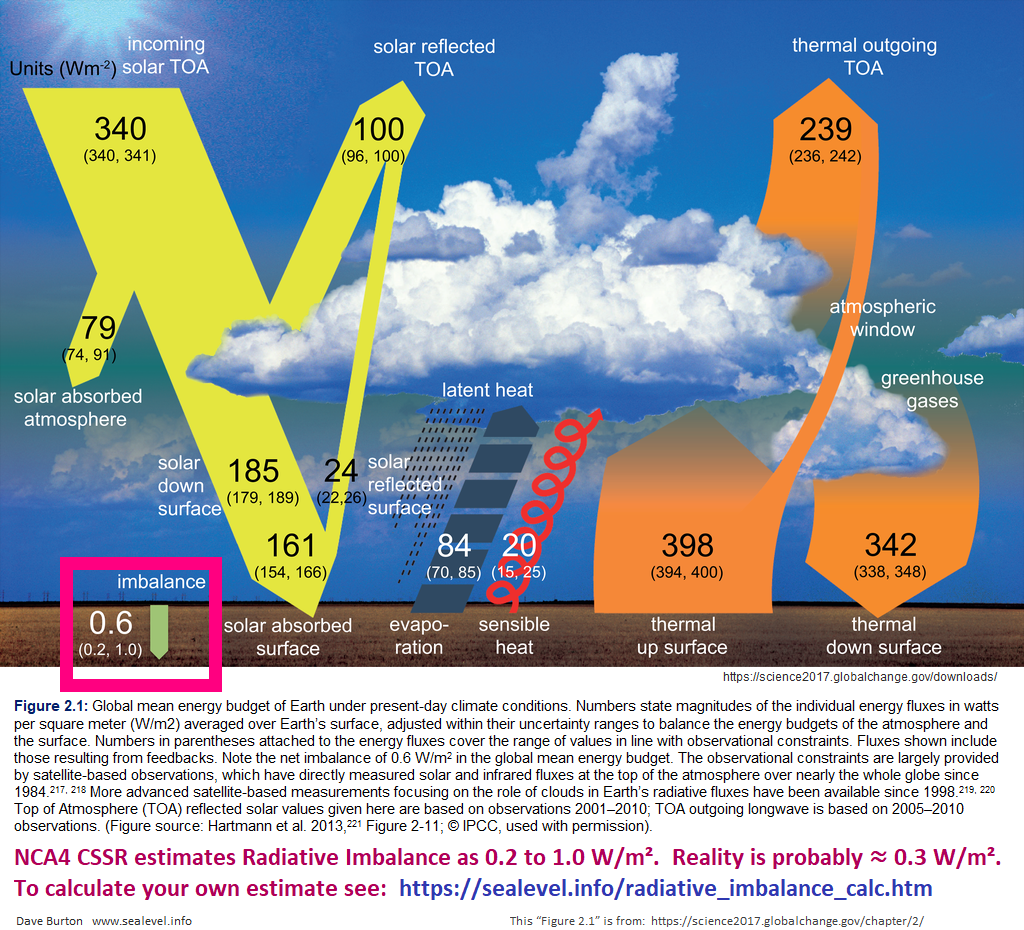
2. NASA's estimate of outgoing radiation at TOA is 239.9 W/m² IR + 77.0 + 22.9 = 339.8 W/m², which is 0.6 W/m² less than the incoming solar radiation. That figure is called the “radiative imbalance.” ↑
The “radiative imbalance” (a/k/a “Earth's energy imbalance”) represents warming “in the pipe,” but not yet realized.
It is poorly constrained, and not directly measurable. I’ve also seen estimates of 0.7 or 0.8 W/m². AR5 and NCA4 estimate it to be between 0.2 and 1.0 W/m². Calculation from realistic estimates of other common climate parameters yields a radiative imbalance estimate of about 0.3 W/m².
A radiative imbalance of 0.6 W/m² would mean roughly 0.6 × 0.3±0.1°C ≈ 0.2 °C, or 0.6 / 2.2±0.2 ≈ 0.3 °C of unrealized warming, depending on sensitivity estimates. ↑
3. Downwelling “back radiation” at the surface, from GHGs in the atmosphere, is estimated as averaging 340.3 W/m². That's about the same as the solar irradiance at TOA, but ≈29% greater than the average amount of solar radiation which makes it to the surface. ↑
4. About 22.6% (77 W/m²) of the incoming solar radiation is reflected back into space, without either reaching the surface or being absorbed. ↑
Thus, an increase of 1 W/m² in LW IR at the surface from GHGs in the atmosphere has an effect on
surface temperatures which is similar to a
That 1.29:1 ratio is approximate, because the effect of sunlight at the surface is not identical to the effect of downwelling LW IR from atmospheric
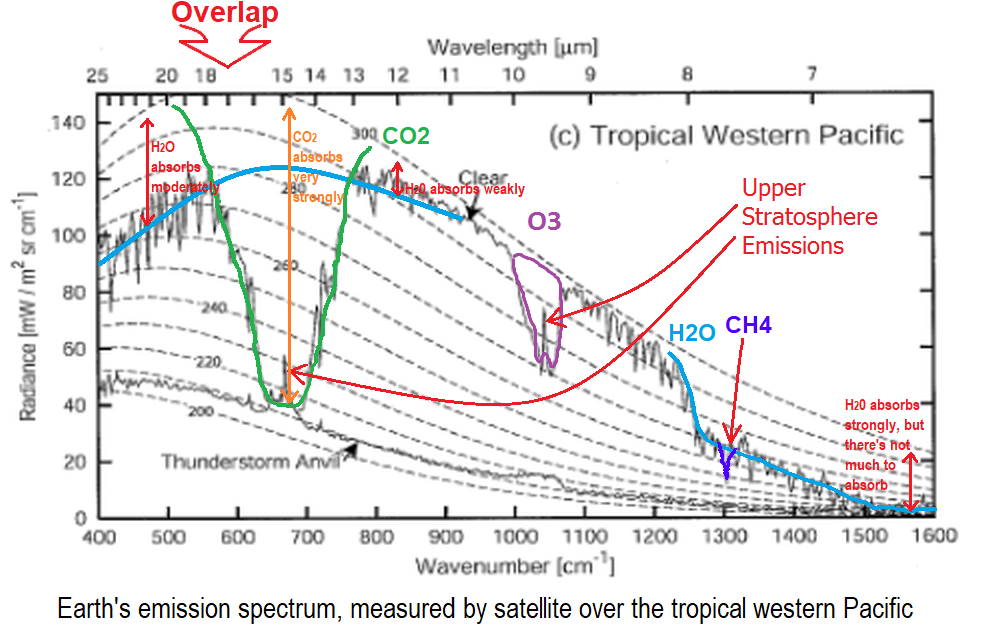
CO2. On one hand, there's some overlap
between the spectrums of CO2 and water vapor, which reduces the warming effect from CO2, especially in the
humid tropics. On the other hand, an estimated 22.9 W/m² (6.7%) of sunlight is reflected from the surface back into space,
which does not happen for LW IR. If that 6.7% were included in the calculation above, it would make an
an increase of 1 W/m² in downwelling LW IR at the surface similar in effect to a
Adjusting the Feldman values for having measured at the surface, rather than TOA, yields about 1.29 × (2.40 ±0.72) per doubling at TOA, and dividing by ln(2), yields the coefficient:
That figure is very close to van Wijngaarden & Happer's “4.28” and Halpern's “4.35”, and closer to Happer's earlier “3.8” than to Myhre's “5.35,” but the uncertainty interval is wide enough to encompass all four estimates. It does preclude the SAR's “6.3” figure.
Rentsch 2020 (unpublished draft), analyzed orbital Atmospheric Infrared Sounder (AIRS) spectroscopy, and found that CO2-induced radiative forcing at TOA from a 37 ppmv CO2
concentration increase (13.65% of a doubling), under nighttime, cloud-clear conditions, caused +0.358 ±0.067 W/m² radiative forcing increase.
Dividing by 0.1365 × ln(2), yields the coefficient:
That's about 70% of the Myhre 1998 / IPCC prediction, and very close to Happer's result.
Kramer, RJ et al. 2021.
Observational evidence of increasing global radiative forcing. Geophysical Research Letters, 48, e2020GL091585.
doi:10.1029/2020GL091585 (preprint)
(article).
3. Warming effect of radiative forcing
To get a feel for what such RF values imply for temperatures, consider that it is calculated that a uniform global temperature increase of 1°C would increase radiant heat loss from the surface of the Earth by about 1.4% (variously estimated to be 3.1 to 3.7 W/m², or 3.1 to 3.3 W/m² in the CMIP5 models — it's complicated; see Cronin 2020). That suggests that a 3 W/m² forcing increase should result in a bit less than 1°C of average eventual warming, and that 0.53 W/m² over 1.5 decades (per Kramer et al) should yield a warming trend of about +0.11°C/decade, which is about right.
However, Koll & Cronin (2018) report that, in practice, with feedbacks, the
relation under clear sky conditions is (surprisingly!) approximately linear, and only about
That relation also gives us a way to estimate warming that is "still in the pipeline," due to current TOA radiative imbalance.
That's basically the temperature difference resulting from the difference between ECS and TCR (except, from all forcings, not just CO2).
TOA radiative imbalance is typically estimated as 0.6 to 0.8 W/m², though it's actually
probably closer to 0.3 W/m².
A radiative imbalance of 0.7 W/m² represents only about 0.3°C of eventual warming "in the pipe"
(which is nearly negligible, for most practical purposes).
• For a deeper dive into “climate sensitivity” (the quantified warming effect of CO2) see:
https://sealevel.info/sensitivity.html
• For graphs of atmospheric CO2 concentration see: https://sealevel.info/co2.html
• For CO2 emissions data see: https://sealevel.info/carbon/