
Satellites & sea-level measurement
(Much of this material is copied & reformatted from https://sealevel.info/resources.html#satellite.)
Aviso, the Univ. of Colorado Sea Level Research Group, NOAA, and several other organizations, all have groups working on sea-level measurement by satellite radar altimetry.
Here are some links to Aviso satellite altimetry info:
• sea-level graph (old) (GIA added)
(on right select Missions🛰→All)
• graph without GIA added (circa 2016, last available version)
• old version graph (circa 2012, used in my paper)
• abbreviated (recent) notes or here,
or longer 2020-2021 version,
or 2020 version,
about processing, revisions, error corrections, etc.
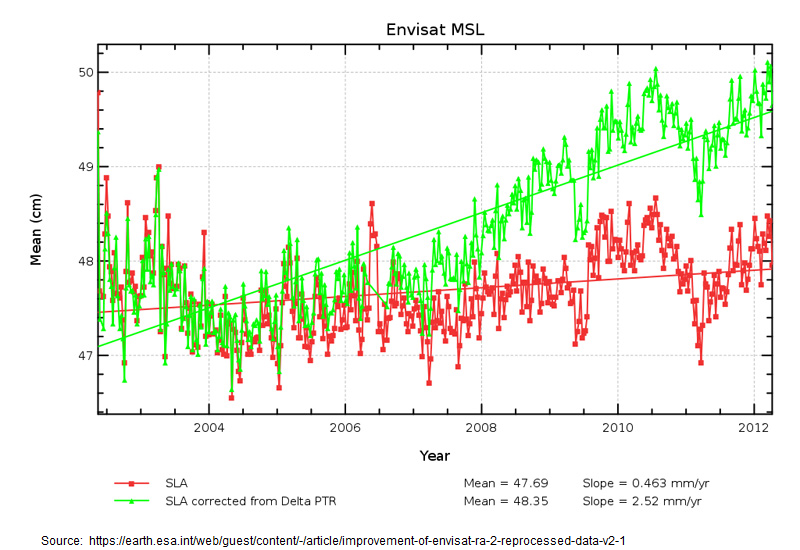
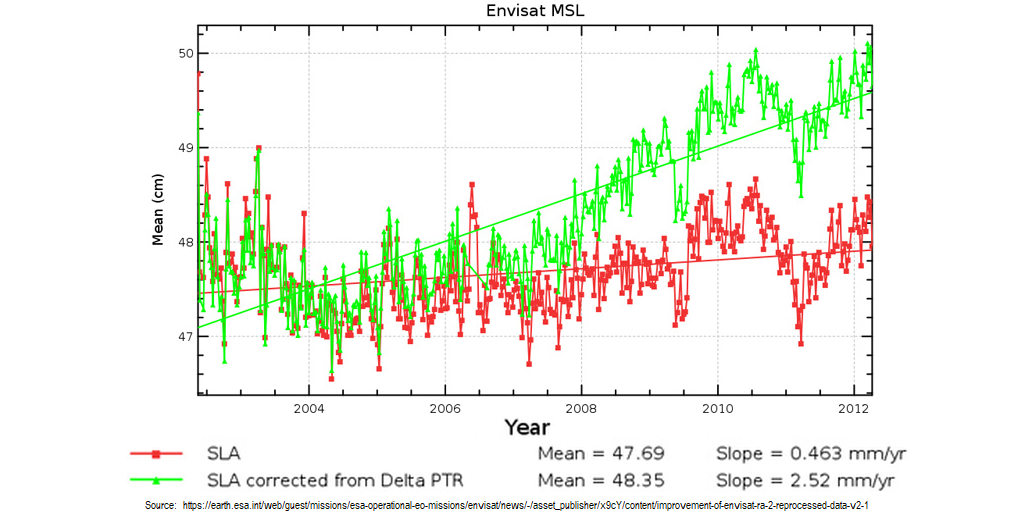
• criticism of their dramatic revisions to ENVISAT data [alt]
• explanation of their dramatic revisions to ENVISAT data
Even though the satellite measurements showed no significant acceleration in sea-level rise, changes in how the satellite data is processed and adjusted have substantially increased the amount of sea-level rise which U. Colorado reports. There are many different factors [2] which can affect reported trends, but which are difficult to ascertain with certainty, and are subject to substantial and often mysterious corrections.

(click to enlarge)
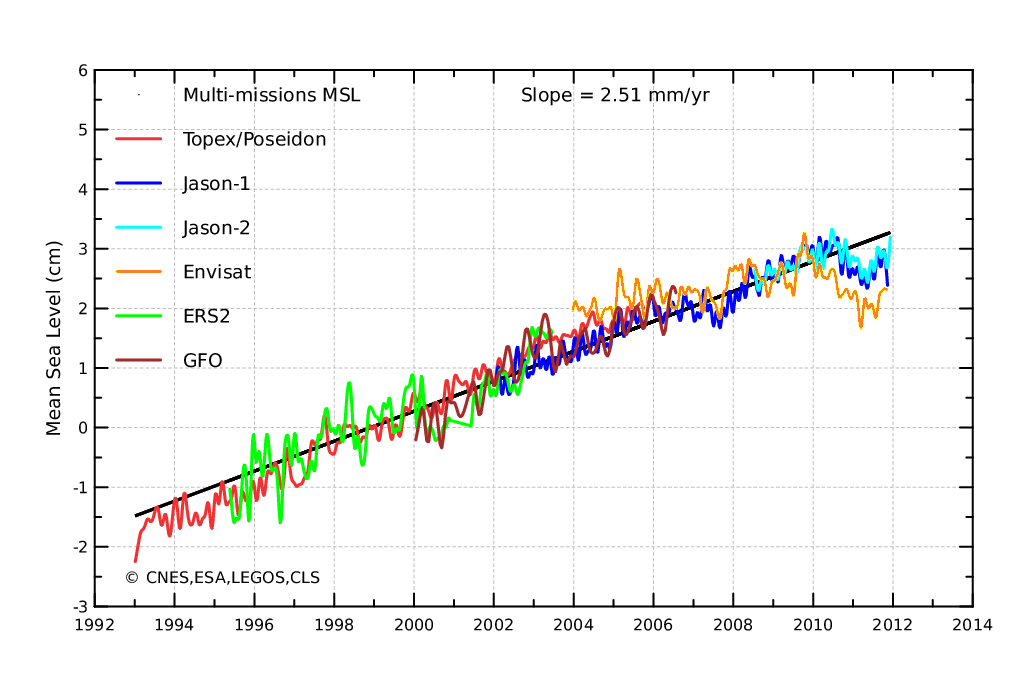
Most satellite altimeters have a lifespan of only about a decade. When they are replaced, many things about their replacements are different, including orbits and instruments — and there are no geodetic survey markers in space, to provide a common reference for calibrating different satellites. Consequently, when those records are spliced together there's the potential for the combined records to be misleading.
To see how malleable the satellite altimetry data is, consider this well-known 2014 paper, which sought to explain away an apparent declining trend (deceleration) in the rate of sea-level rise measured by satellite altimetry. They managed to massage the data until that embarrassing decline had almost entirely disappeared. (Does that remind you of anything?)
Here are two pairs of graphs from the paper, each with “before” and “after” versions, showing how they “corrected” the work of 5 (five!) different satellite altimetry analysis groups, to almost completely eliminate the decline, which all five groups had measured:

(click to enlarge)

(click to enlarge)
In a 2017 paper they finished the process. With additional adjustments to old data, and a few more years of new data, the same group finally managed to find the elusive acceleration:

(click to enlarge)
Of course, coastal (tide gauge) measurements of sea-level are not subject to such adjustments, and they remain stubbornly linear:

(click to enlarge)
This article & comments at WUWT have a good discussion of how adjustments have increased rate of sea-level rise reportedly “measured” by satellite altimetry.
(h/t Steve Case [here+here and
here
here])
Another example illustrating the malleability of the satellite altimetry data is a widely-hyped 2018 paper by U. Colorado's Dr. Steve Nerem et al, which claimed to have discovered “acceleration” in the satellite altimetry measurement record of sea-level — by reducing the rate of measured sea-level rise in 20 year-old Topex-Poseidon data, thereby making more recent measurements appear to have accelerated, by comparison:

(click to enlarge)
From Frank Lansner and Jo Nova comes an enlightening but disturbing article about suspicious adjustments to sea-level measurement data from satellite altimetry.
Unfortunately, measurement of sea-level by satellite altimetry is fundamentally unreliable. Physicist Willie Soon explains the problems starting at 17:37 in this very informative hour-long lecture.

To address some of these problems, in 2011 NASA proposed (and re-proposed in 2014 / 2015) a new satellite mission called the Geodetic Reference Antenna in SPace (GRASP). The proposal is discussed here, and its implications for measuring sea-level are discussed here. The Europeans are apparently considering a similar mission
More resources
DORIS (Doppler Orbitography and Radiopositioning Integrated by Satellite) is a Doppler satellite tracking system for determining satellite locations.
NOAA's National Geodetic Survey CORS program (Continuously Operating Reference Stations) provides satellite-based 3D positional data, measuring subsidence, uplift, and lateral movement of the Earth's surface at more than 1,900 locations. Here's a map showing the station locations: http://www.ngs.noaa.gov/CORS_Map/.
SONEL is a French organization; they have GPS station resources, vertical land motion (VLM) estimates, and tide-gauge data.
SeaLevel.info
Twitter card