NASA GISS shadowbanning comments on their propaganda video, on YouTube and Facebook
Here's the propaganda video, variously entitled, "Sea Level Rise Accelerates Over Time" (which is untrue),
and "New Study Finds Sea Level Rise Accelerating" (which is misleading, because the study was flawed, and
contradicted by other studies):
1. On NASA's site:
https://www.nasa.gov/feature/goddard/2018/new-study-finds-sea-level-rise-accelerating
2. On Youtube:
https://www.youtube.com/watch?v=VYnReLNLAZ0
3. On Facebook:
https://www.facebook.com/NASA/videos/10156020865631772/
NASA's site doesn't support posting comments, but Youtube and Facebook do. That doesn't do much good, however, because on BOTH YouTube and Facebook, comments on this video are being selectively shadowbanned, which prevents correction of the misinformation in the video.
Here's a Facebook screenshot (click on it to enlarge it). The comments identified as shadowbanned
are only visible in this screenshot because the screenshot was made while logged into my account.
Those comments are invisible to anyone else:

Here's a Youtube screenshot (click on it to enlarge it; you might need to click twice):

Here's a slightly modified version of the first of the shadowbanned comments that I tried to post (I inlined the images in this version): ↑
This video is propaganda, not science.
It is based on Nerem et al 2018, which completely ignored COASTAL sea-level measurements. Here's the paper:
https://www.pnas.org/doi/10.1073/pnas.1717312115
Here's an excellent discussion of that paper:
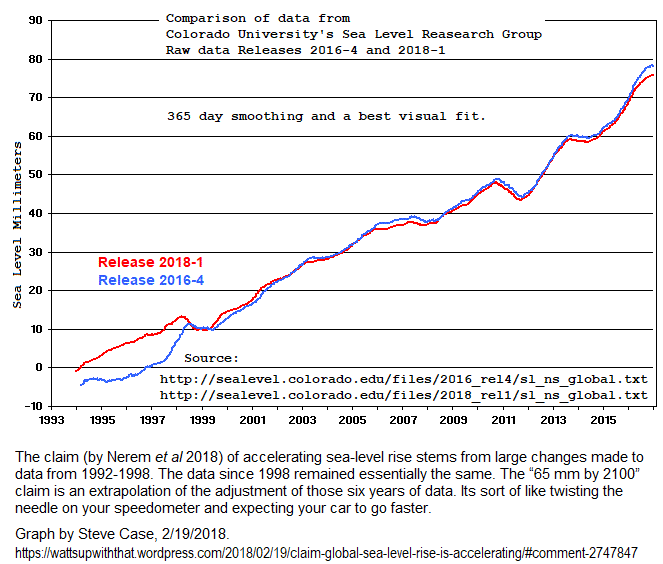
Nerem et al claimed to have discovered "acceleration" in the satellite altimetry sea-level data. But
when you read the details you discover that the "acceleration" they found was created by SLOWING the rate of
rise of sea-level rise "measured" by Topex-Poseidon prior to 1998. Yes, you read that right: they "fixed" 20yo
data, thereby creating the appearance of acceleration when the early Topex-Poseidon data is compared against
the newer satellites' data (even though the new Jason-3 measurements show little sea-level rise, so far).

(That drastic revision of the Topex-Poseidon rate also LOWERED the average rate from the previously reported 3.4 mm/yr to the currently claimed 3.1 mm/yr.)
Contrary to this video, the longest, highest-quality measurements of COASTAL sea-level show that the rate of sea-level rise (or, in some cases, the rate of sea-level fall) hasn't significantly accelerated in at least nine decades.
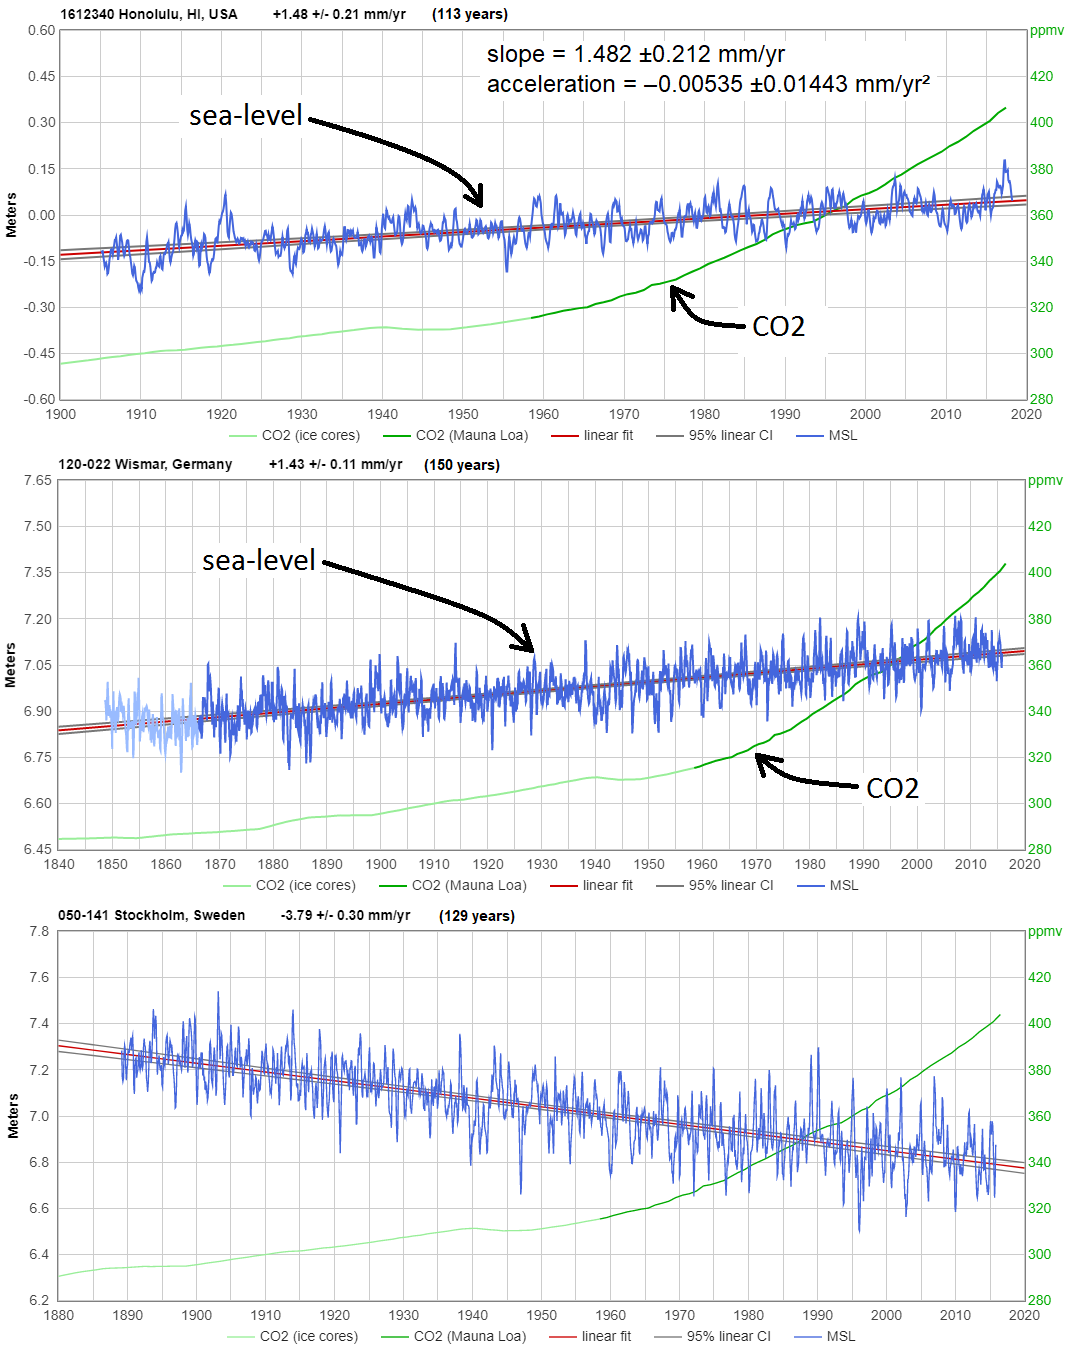
Here are three especially high-quality sea-level measurement records (in blue), all more than a century long,
in each case juxtaposed with atmospheric CO2 levels (in green):
https://sealevel.info/1612340_Honolulu_Wismar_Stockholm_vs_CO2_annot3.png

Here are "interactive" versions of all three graphs:
https://www.sealevel.info/MSL_graph.php?id=Honolulu
https://www.sealevel.info/MSL_graph.php?id=Wismar&boxcar=1&boxwidth=3
https://www.sealevel.info/MSL_graph.php?id=Stockholm&boxcar=1&boxwidth=3
The first two graphs show very typical sea-level trends from especially high-quality measurement records, on opposite sides of the Earth (12 time zones apart, during summer). They're both at sites which are little affected by distortions like tectonic instability, vertical land motion, and ENSO. The trends are nearly identical, and perfectly typical: only about 6 inches per century, a rate which hasn't increased in more than nine decades.
That is so tiny that it is basically negligible, because it is less than many common coastal processes, like salt marsh vegetation buildup, sedimentation, erosion, coral growth, and vertical land motion. In fact, in many places apparent sea-level rise is negative, because vertical land motion exceeds the rate at which the ocean is rising.
One of those places is Stockholm, the third graph. "Sea-level rise" there is actually negative, because the
tiny global trend it is dwarfed by regional vertical land motion. Because the land is rising at Stockholm,
sea-level is falling there, at a rate of about 18 inches per century (which adds to their dredging expense):
When I show climate alarmists graphs like those, they usually have a hard time believing it. They often accuse
me of cherry-picking. So here is NOAA's full 2016 list of 375 tide stations, for which they did long term trend
analysis; click any of the thumbnails for details:
http://sealevel.info/MSL_global_thumbnails5.html
Those graphs show that sea-level rise is NOT accelerating, and rising CO2 levels have not affected the
sea-level trends. If that isn't obvious to you, because you don't know how to recognize "acceleration" in a
graph, here's a little primer that should help you:
https://www.sealevel.info/acceleration_primer.html
What the numerous large revisions in satellite altimetry measurements of sea-level (and their inconsistency with the coastal measurements) demonstrates is how malleable and unreliable the satellite altimetry "measurements" of sea-level are, compared to tide gauge (coastal) measurements.
There are many problems with the satellite altimetry data. One is simply that satellite altimetry measures sea-level in the wrong place. The satellites cannot measure sea-level at the coasts, at all -- and the coasts are the only places where sea-level trends matter.
Also, the satellite measurement records are extremely short. Their longest single-instrument measurement record is only about a decade. In contrast, many coastal measurement records (including Honolulu) are well over a century in length, and quite a few are over 1.5 centuries.
Proof of the poor quality of the satellite altimetry measurements is to be found in the many revisions to already-measured "measurements." Trustworthy measurement data does not require endless revision and correction, long after it has been collected!
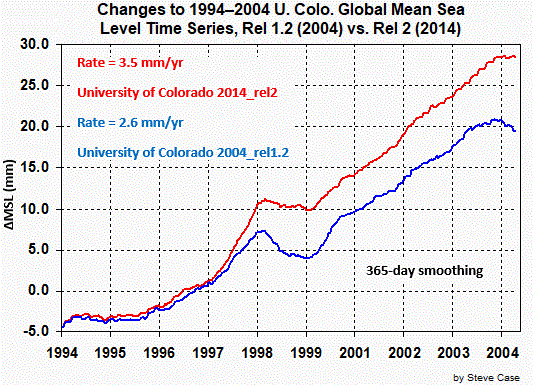
One of the major groups working with satellite altimetry measurements of sea-level is at the University of
Colorado. Changes in how they process and adjust that data have greatly increased the amount of sea-level rise
which U. Colorado reports (h/t Steve Case):
https://www.sealevel.info/331k5ya_recaptioned2.png
Here's a good article:
Aviso is a European group. Their revisions to the ENVISAT "measurements" of sea-level were even MORE drastic
than U. Colorado's revisions to Topex-Poseidon data:
https://www.sealevel.info/2061wtl.jpg

The small graph is the "before" version. The larger graph is scaled identically. It was produced by the SAME group, using the SAME measurement data, from the SAME satellite -- and it approximately TRIPLED the reported rate of sea-level rise.
Here is Aviso's list of factors which can distort measurements of sea-level by satellite altimetry:
Now, why on earth would anyone choose to use such low quality data, and completely IGNORE the vastly higher quality sea-level measurements from tide gauges, as Nerem did?
When people cite low quality data and ignore high quality data, it's often sign of bias: they're picking the studies which come closest to confirming their prejudices. They're trying hard to find what they want to find, and ignoring contrary evidence.
You see the same sort of behavior when people cite GRACE studies and ignore ICESat and ERS, w/r/t Antarctica ice mass balance.
That sort of behavior is useful -- but mainly for identifying scientific work which you should not trust!
Every year the so-called “greenhouse forcing” from rising CO2 levels increases. A naive glance at a
typical CO2 level graph might lead you to think that the forcing is exponentially increasing, causing you to
fear that temperatures might also increase exponentially. But, in fact, since CO2's warming effect is
logarithmically diminishing, the so-called “greenhouse forcing” trend has been only barely more than
linear for about forty years (and there’s good reason to expect that to decrease over the rest of the
century). You can see that near-linearity in a log-scale plot of CO2 level:
https://sealevel.info/co2.html?co2scale=2

That means we've done the experiment, and we've seen the result. The data show that an extended period of rising GHG emissions & levels has had no detectable effect on sea-level, and there's no good reason to expect that it ever will.
Note: NASA appears to be shadowbanning many comments on this video, as you can see here:

Learn more about climate change, here:
https://sealevel.info/learnmore.html