MWP & LIA vs. the “hockey stick”
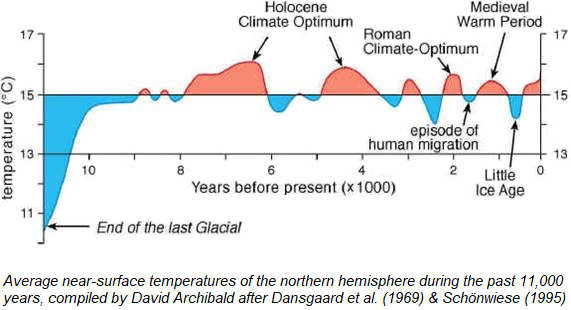
It used to be that most scientists agreed that, over the last few thousand years, the Earth's climate has oscillated, on timescales of a few centuries, between warm “climate optimums” and unpleasant cold periods: the long Mid-Holocene Climate Optimum (when temperatures were apparently substantially warmer than now), followed by a cooler period, which was followed by the Minoan or Bronze Age Warm Period, followed by the Iron Age Cold Period, then the Roman Warm Period or Roman Climate Optimum (“RWP”), then the Dark Ages Cold Period (“DACP”), then the Medieval Warm Period or Medieval Climate Optimum (“MWP”), then the Little Ice Age (“LIA”), and finally the Current Warm Period (Modern Climate Optimum).
Ice core data showing a decline in atmospheric CO2 level from the MWP to the LIA is evidence that it was a global (or near-global) phenomenon.
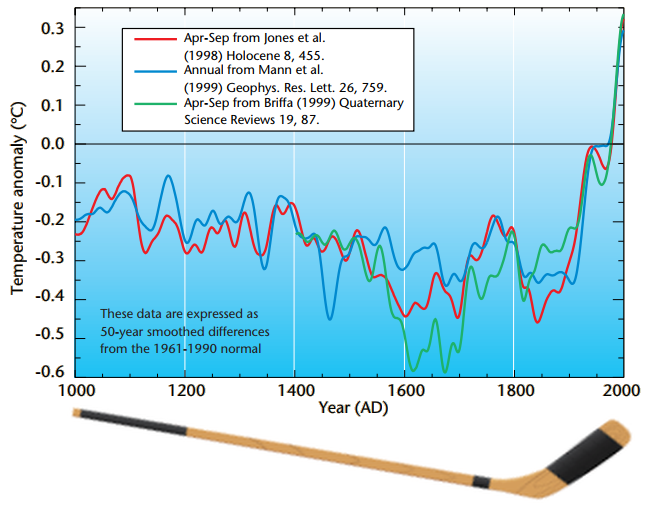
However, that chronology represents a problem for climate alarmism, since it indicates that there's nothing particularly unusual about the warming which occurred during the 20th century. In 1999, Mann, Bradley & Hughes challenged that orthodoxy with a new temperature reconstruction, in their heavily-hyped “hockey stick” paper, which erased the MWP and LIA to create a straight “hockey stick handle” from 1000 AD to 1900 AD, followed by a sharp “hockey stick blade” of rising temperatures in the 20th century. ↑
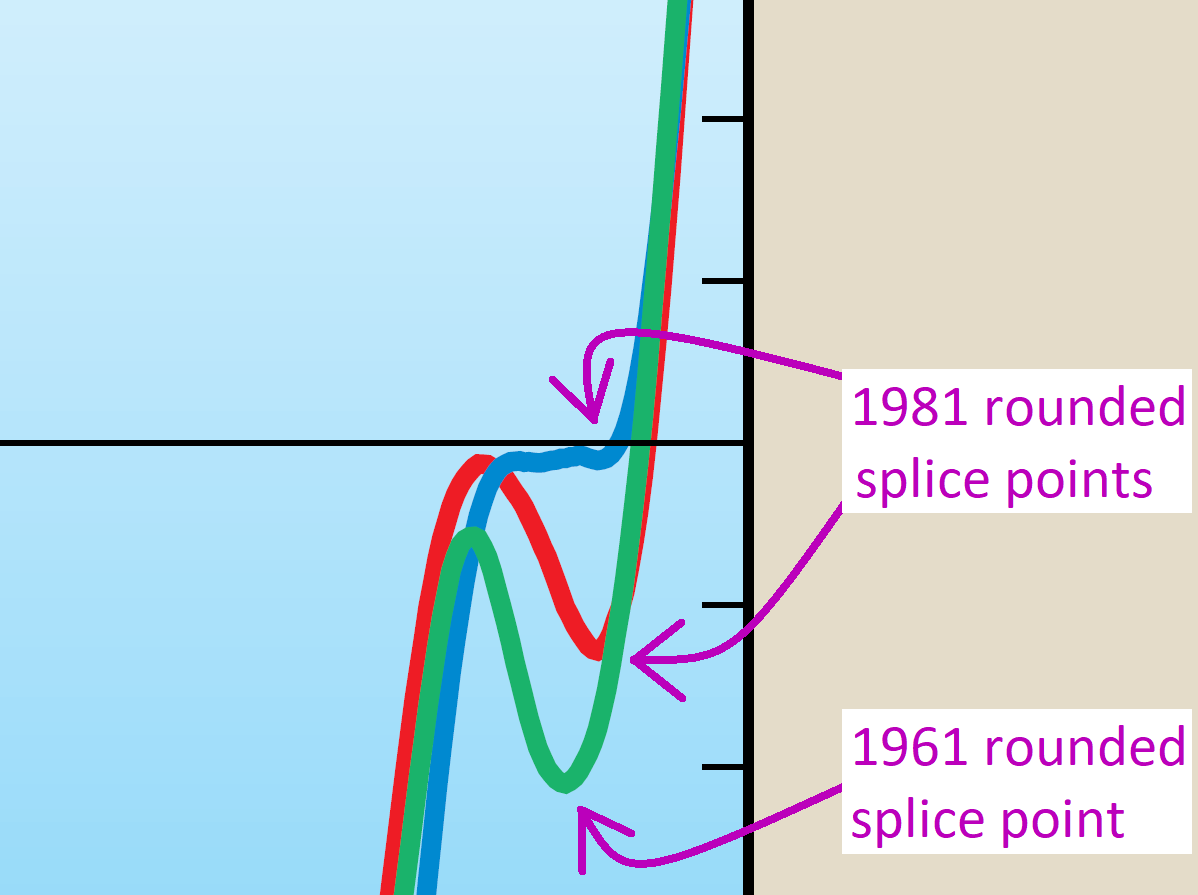
A variant of the hockey stick graph from that paper, created by Phil Jones, also appeared on the cover of the World Meteorological Organization's alarming 1999 Climate Statement. In that graph, Jones infamously used “Mike's Nature Trick” (“Mike” was Michael Mann), of splicing measured temperature data into a graph of temperature “proxies,” to “hide the decline” in climate proxies, which would have spoiled the “hockey stick shape” of the graph, discredited their tree ring proxy-based temperature reconstruction methodology, and undermined the narrative of alarming global warming. ↑
Jones used identical colors for the proxy reconstruction data and instrument data, and rounded the three splice points to hide the splices. Despite the graph labels which claimed that the three traces were proxies, from 1981 on all three traces were actually real (instrument) temperature data (and the green trace was real temperature data from 1961 on). Yet the three traces of the same instrument data were slightly different, because, to hide the splice points, Jones had to bend the traces a bit, to make them line up with the three proxy traces.
The emails between Jones, Mann, Bradley, Hughes and others, discussing that graph and “trick,” were among the most infamous revelations of the Climategate scandal.
The debate rages on:
• On one side, the indispensable CO2 Science project has compiled an extensive collection of studies and papers with evidence for the traditional view: that the MWP and LIA were real and global. Also, here are two articles and a map, showing the preponderance of studies which support that view.
• On the other side, the Pages 2K Network (or here) was created in 2008, to compile evidence for the merely “regional nature of the Medieval Warm Period and the Little Ice Age.” (That contention is quoted from the caption on Fig. 1 of their poster, though they more frequently use the revisionist term, “Medieval Climate Anomaly” or MCA.)
Canadian mathematician Steve McIntyre has written an excellent multi-part critique of the Pages2K project here, and has compiled a large collection of “hockey stick study” resources here. He also famously debunked Marcott et al (2013), another paper which attempted to erase well-documented warm and cold cycles from history.
2020-07-16: Ice cores from ice sheets contain tiny air bubbles, which record CO2 levels (among other things) from thousands of years in the past. (The records are quite precise for the last 400K years, and less precise for twice that long.) They show that, prior to the industrial revolution, CO2 levels typically rose & fell as a result of global temperature changes, rising a total of about 90 ppmv from glacial maxima to interglacial peaks.
Here are Law Dome (Antarctic) ice core data, back to year 1010. (Scroll down past “CO2, 75 Year Smoothed.”)
They show that CO2 levels peaked at ≈284.1 ppmv circa 1170 (MWP), and fell to their lowest level of ≈275.3 ppmv circa 1615 (LIA):
https://www1.ncdc.noaa.gov/pub/data/paleo/icecore/antarctica/law/law_co2.txt
That's a problem for those who claim that the MWP was merely regional (North Atlantic), because they cannot explain evidence of the MWP showing up in CO2 records, all the way down in Antarctica.
If you'd like to learn more about climate change, I've compiled a short list of good resources, here:
https://sealevel.info/learnmore
https://sealevel.info/resources.html#mwp_lia)
SeaLevel.info


