Carbon & CO2 fluxes: what we know,
and what we can deduce
by Dave Burton sealevel.info
There are many CO2 “sources” and “sinks” which affect the concentration of CO2 in the Earth's atmosphere, but there are only a few key sources of information about them.
Table of contents:
What we know:
1. Measured atmospheric CO2 concentrations
2. Total amount of CO2 in the atmosphere
3. Anthropogenic CO2 emissions
What we can deduce:
4. Natural CO2 removals from the air, and why CO2 levels are rising
5. How CO2 removal rates relate to atmospheric CO2 concentration
6. How carbon feedbacks limit CO2 concentrations
1. Measured atmospheric CO2 concentrations
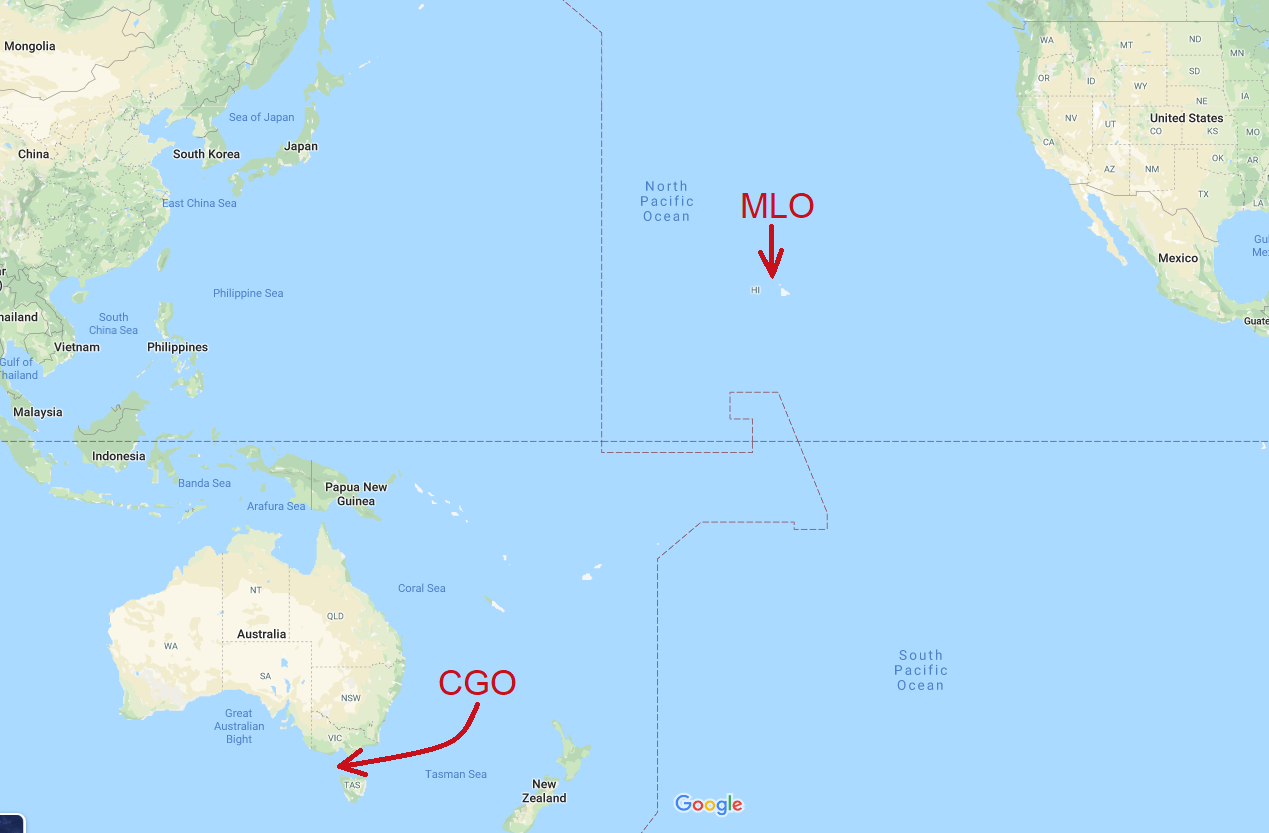
Precise measurements of atmospheric CO2 concentrations began in earnest in March, 1958 at Mauna Loa Observatory (MLO) in Hawaii, and have continued to this day. These data are of superb quality. I have high confidence that the annually averaged Mauna Loa CO2 measurements deviate less than 1% from the true, global, atmospheric annual averages. (Earlier measurements were of much lower quality.)

Excellent measurements of CO2 concentrations are also made in other places, but they started later. They give us insights to the local and hemispheric seasonal cycles in CO2 levels, due to seasonal plant growth and decomposition. For instance, measurements at Cape Grim Observatory (CGO) in Tasmania show a weaker and opposite-polarity seasonal signal, compared to MLO measurements, and the annually averaged levels there are a few ppmv lower than MLO's.

For years prior to 1958, the best atmospheric CO2 concentration data is from analysis of trapped air bubbles
in Antarctic ice cores. Those data have the disadvantage of being “smeared” (smoothed) over at least a decade
(at sites with high rates of snowfall accumulation, like Law Dome), or even longer (at sites with low rates
of snowfall accumulation).
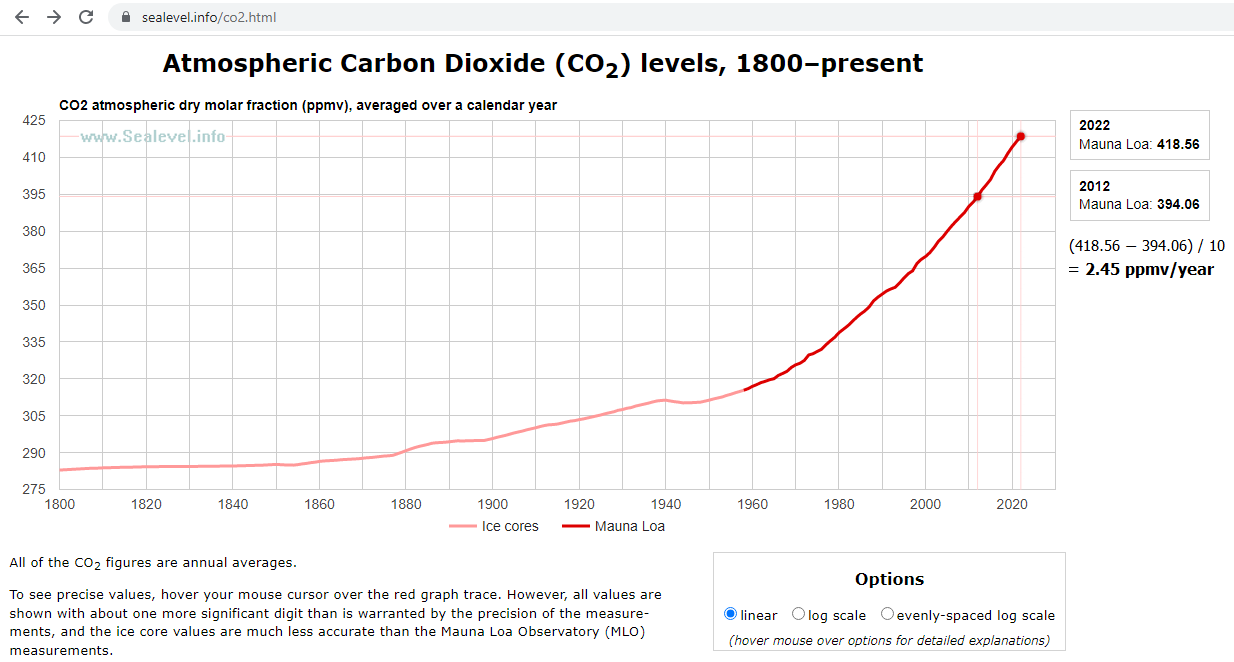
Here's a combined “interactive” graph of CO2, with both Mauna Loa and ice core data:

2. Total amount of CO2 in the atmosphere
tl;dr: 1 ppmv CO2 = 7.8024 Gt CO2 = 2.12940 PgC
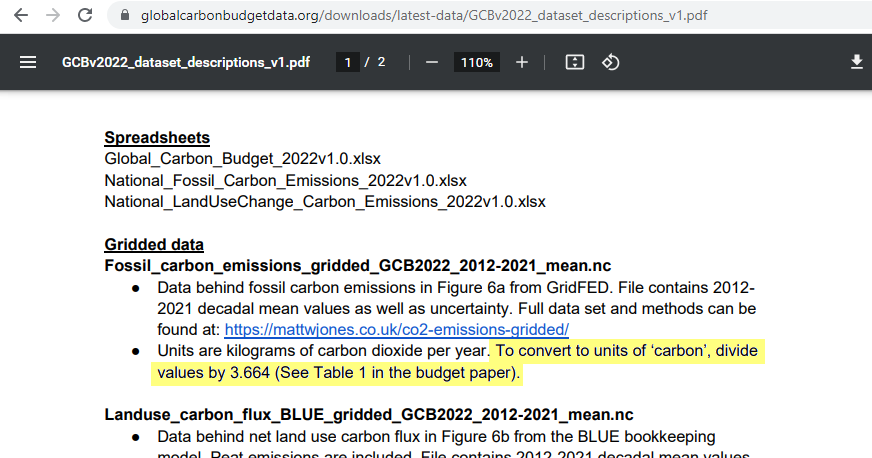
To convert from PgC to Gt CO2 multiply by 3.6642
Details: The total amount of CO2 in the atmosphere can be directly calculated from the
average atmospheric CO2 concentration, because the total mass of the Earth's atmosphere is quite precisely
known. (It is deduced from atmospheric pressure at sea-level, and the circumference of the Earth, adjusted
to account for the volume of atmosphere displaced by land, water & ice above sea-level.) The Earth's
atmosphere is generally estimated to have a mass of about 5.1480 × 10^18 kg including water vapor, or a
dry mass of 5.1352 ±0.0003 × 10^18 kg (because about 0.25% of the atmosphere's mass is water vapor, which
is 0.41% by molar fraction). (Earlier estimates tended to be slightly higher, e.g. around 5.3 × 10^18 kg.)
5.1352 × 10^18 kg = 5.1352 million Gt, so one ppm (part-per-million of dry atmosphere) weighs about 5.1352 Gt.
However, atmospheric gas concentrations are customarily expressed in ppmv (parts-per-million by volume, a/k/a molar fraction, µmol/mol), not by mass, so to calculate the mass of one ppmv of a particular gas requires scaling according to the molecular weight of the gas in question. (Note: if water vapor is ignored, as is usually the case, this is properly called the dry molar fraction.)
The average molecular weight of dry air is
28.9647 g/mol.
So:
1 ppmv CO2 (molecular weight
44.0095)
has mass (44.0095 / 28.9647) × 5.1352 Gt
= 7.8024 Gt CO2, of which (12.0107 / 44.0095)-ths
= 2.12940 PgC (Gt C) is carbon.
1 Pg (petagram) = 1 Gt (gigatonne). So:
1 PgC (“petagram carbon”) is contained in
= 0.46962 ppmv CO2 which masses
= 3.6642 ±0.0003 Gt CO2.
(Note: GCP rounds 3.6642 down to 3.664 MtCO2/MtC.)
Example:
420 ppmv CO2 has mass
(420 ppmv × 7.8024 Gt/ppmv) = 3277.0 Gt.
That much CO2 contains 3277.0 Gt / 3.6642 Gt/PgC = 894.3 PgC
= (420 ppmv × 2.12940 PgC/ppmv) = 894.3 PgC
3. Anthropogenic CO2 emissions
Since the 1700s we have reasonably good records of the commercial production of fossil fuels and concrete, which are the main sources of anthropogenic CO2 emissions. From that data, total anthropogenic “fossil CO2” emissions can be estimated quite closely, i.e., perhaps within ±5% for recent years, certainly no worse than ±10%.
Another source of “anthropogenic CO2 emissions” is land use changes. When forests are cleared or peat bogs are drained for agriculture, considerable CO2 is released. In fact, that is believed to have been the largest source of anthropogenic CO2 emissions before the 20th century.
Unfortunately, CO2 emissions due to land use changes are imprecisely known. The Global Carbon Project (GCP) reports and extrapolates data from three recent studies, with hugely varying estimates:

Largely because of the imprecision with which land use change effects are estimated, they are sometimes not counted among “emissions.” Instead, they can be considered as a diminishment of natural CO2 removals. That has the advantage of considerably improving the precision with which “emissions” can be stated with confidence.
Here are seven spreadsheets of CO2 emission data. The first one (CDIAC) has data only through 2014, the rest have data through 2021. ↑
The first three are “fossil CO2 only” (meaning from fossil fuels and cement manufacturing), from three different sources. The next three are the same source as the #3 (GCP) fossil CO2 only spreadsheet, but with three different estimates of land use change effects added. The last spreadsheet is simply the average of the previous three spreadsheets (the ones with land use change effect estimates). Each spreadsheet is available in two formats: text (handy for online viewing), and .xlsx (Microsoft Excel) file.| 1. | CDIAC 1751-2014 (obsolete) | text file | .xlsx spreadsheet |
| 2. | BP + Andrew (fossil CO2 only) | text file | .xlsx spreadsheet |
| 3. | GCP (fossil CO2 only) | text file | .xlsx spreadsheet |
| 4. | GCP with OSCAR land use est. | text file | .xlsx spreadsheet |
| 5. | GCP with BLUE land use est. | text file | .xlsx spreadsheet |
| 6. | GCP with H&N land use est. | text file | .xlsx spreadsheet |
| 7. | GCP with averaged land use est. | text file | .xlsx spreadsheet |
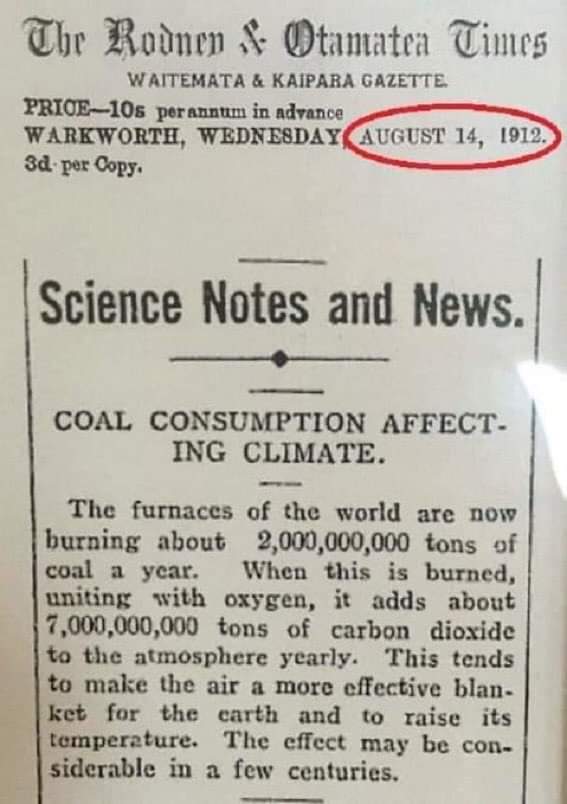
(Notes: 1. In each spreadsheet, it's the first two columns which are mainly of interest: column A is the year, and column B is the estimated total anthropogenic emissions for that year, in million metric tonnes of carbon [MtC]. 2. The early data are imprecise. For instance, these modern sources give 1911 & 1912 carbon emissions from coal as only about 0.792 & 0.833 PgC, respectively (= 2.90 & 3.05 Gt CO2), but this 1912 New Zealand article gave annual coal use as 2.0 billion tons [presumably long tons], yielding 7.0 Gt CO2 [suggesting 94% carbon content], which is about 230% to 240% of the estimates given by these modern sources.)
All sources agree that CO2 emissions due to land use changes are less than 15% of the total, now. But that was not always the case. Interestingly, all three of the studies estimating land use change effects indicate that land use changes (rather than fossil carbon emissions) were the greatest contributor to anthropogenic CO2 emissions until at least 1912. Only in the early or mid-20th century did fossil fuels come to dominate total anthropogenic CO2 emissions. In fact, according to one of the land use effect studies (BLUE), fossil carbon emissions didn't exceed the emissions from land use changes until 1961!
From those data some interesting things can be deduced:
4. Net natural CO2 removals from the air, and the cause of rising CO2 levels
From measurements of CO2 levels since 1958, the year-to-year (or longer period) changes in atmospheric
CO2 level can be determined, simply by subtracting an earlier measured level from a later measured level.
CO2 emissions are reported by year, so that's the shortest period we can use. It takes a couple of months
for emitted CO2 to disperse within the hemisphere in which it was emitted, so comparing the first quarter
average CO2 level in year X to the first quarter average CO2 level the following year gives a good
approximation of the global increase in atmospheric CO2 during year X. Here's a spreadsheet
with those data, in two formats:
text file .xlsx spreadsheet
Example: 2021 ↑
E.g., in 1Q of 2022 the average CO2 level measured at MLO was 418.760 ppmv, and in 1Q of 2021 the average
level was 416.637 ppmv, so the level increased by 2.123 ppmv in 2021, which is:
2.123 ppmv CO2 × 7.8024 Gt / ppmv CO2 = 16.56 Gt CO2
2.123 ppmv CO2 × 2.1294 PgC / ppmv CO2 = 4.52 PgC
In other words, the amount of carbon in CO2 in the atmosphere increased by about 4.52 PgC in 2021.
It is instructive to compare that figure to the anthropogenic CO2 emissions in 2021. Here they are, according to the estimates from the spreadsheets, above:
| 2. | BP + Andrew (fossil CO2 only) | reference | 9.79 PgC |
| 3. | GCP (fossil CO2 only) | reference | |
| 4. | GCP with OSCAR land use est. | reference | 11.31 PgC |
| 5. | GCP with BLUE land use est. | reference | 11.60 PgC |
| 6. | GCP with H&N land use est. | reference | 10.77 PgC |
| 7. | GCP with averaged land use est. | reference | 11.23 PgC |
(Notes: 1. “Fossil CO2” is CO2 from burning fossil fuels and from making cement. 2. The “reference” entries in that table use Chrome “text fragment links” to link directly to the corresponding 2021 emission figures. If you're using Firefox or Safari that won't work, but you can find the entry by scrolling down to the last line of the table [the “2021” entry].)
According to those estimates, mankind added between 9.79 PgC and 11.60 PgC to the atmosphere in 2021. Yet the amount of carbon in CO2 in the atmosphere increased by only 4.52 PgC. That means that natural “carbon sinks” (the terrestrial biosphere & soil, the oceans, rock weathering, etc.) removed a net total of at least 9.79 - 4.52 = 5.27 PgC in 2021.
That means the entire increase in atmospheric CO2 in 2021 was due to human CO2 emissions. “Nature” (i.e., net summed natural CO2 sources & sinks) removed at least 2.47 ppmv of CO2 from the atmosphere, yet the amount of CO2 in the atmosphere nevertheless increased by 2.12 ppmv, because mankind added CO2 faster than nature removed it.
5. How CO2 removal rates relate to atmospheric CO2 concentration
[incomplete]6. How carbon feedbacks limit CO2 concentrations
[incomplete]
Last modified: 18-Jun-2025 (version 15)
Copyright © 2022-2024, David A. Burton.