OBSOLETE — This document has been replaced by https://sealevel.info/Radiative_Forcing.html
Radiative forcing at TOA vs. surface
Feldman et al 2015 monitored downwelling longwave infrared “back radiation” under clear-sky conditions for a decade, and measured the increase at wavelengths where CO2 emits. Interestingly, they detected less of an increase in LW IR than climate alarmists and their models predict, though they didn't mention that fact in their paper.
The radiative forcing from a doubling of atmospheric CO2 levels is usually estimated as 3.7 ±0.4 W/m², but that's probably too high. Atmospheric physicist Will Happer has found evidence that CO2's forcing is commonly overestimated by about 40%. If that is correct, it means CO2's forcing is only about 2.6 W/m² per doubling. Feldman's measurements indicate that CO2's forcing at the Earth surface is only 2.40 ±0.72 W/m per doubling, which is consistent with Happer's result, and inconsistent with the commonly claimed 3.7 W/m² TOA figure.
However, it is worth discussing the distinction between effect of GHGs on radiation balance at TOA, and their effect at the surface. Feldman et al measured downwelling radiation at the surface, from GHGs in the atmosphere, but the effect of a “forcing” is usually specified by its equivalent in solar forcing at TOA. They are similar, but not identical.
The only way that energy leaves the Earth at TOA is by radiation, but at the Earth's surface the energy fluxes are much more complicated, including important mechanisms like convection and evaporative cooling. Warming the Earth causes its rate of cooling to increase by all of those mechanisms, making them negative feedbacks. Those negative feedbacks limit the temperature increase which results from an increase in any forcing.
GHGs in the atmosphere have their effect on temperature by absorbing outbound longwave IR radiation from below, which otherwise would have escaped to space. Absorbing that radiation warms the atmosphere. That, in turn, increases radiation from GHGs in the atmosphere, about half of which goes back down toward the surface, as “downwelling” or “back radiation,” which warms the surface. Hence, the surface and the lower troposphere warm or cool together.
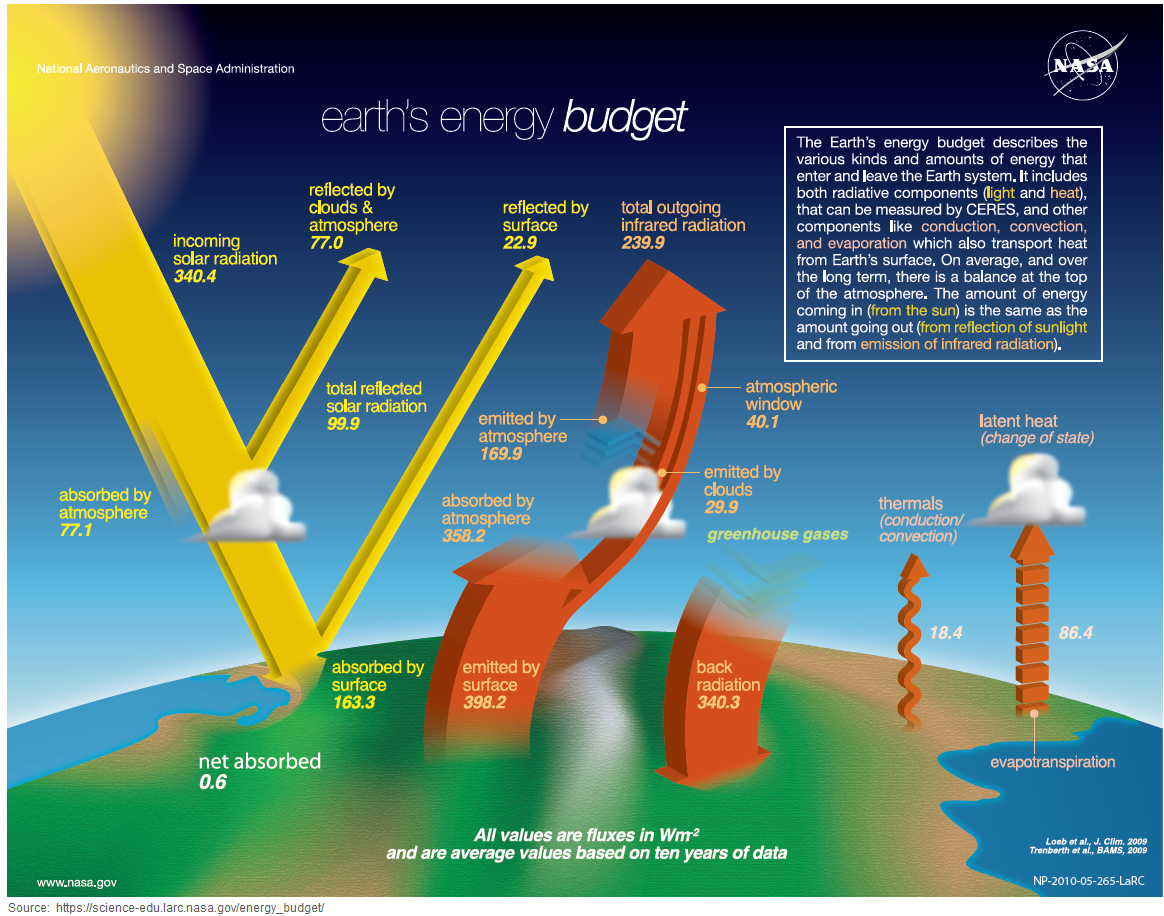
Here's NASA's 2014 (latest?) version of the famous Trenberth energy flow diagram:

That diagram was discussed on WUWT, here:
https://wattsupwiththat.wordpress.com/2014/01/17/nasa-revises-earths-radiation-budget-diminishing-some-of-trenberths-claims-in-the-process/
The numbers in that diagram:
The diagram shows:
1. Incoming solar radiation at TOA = 340.4 W/m². That's 1/4 of the 1360 to 1365 W/m² that you might recall as the “solar constant,” because the 136x figure is where the Earth directly faces the Sun, and the 340.4 figure is averaged over the entire globe, including the back side. (The surface area of a sphere is exactly four times the area of a circle of same radius.)
2. About 22.6% (77 W/m²) of the incoming solar radiation is reflected back into space, before it ever gets to the surface.
3. Estimated outgoing radiation at TOA is 239.9 W/m² IR + 77.0 + 22.9 = 339.8 W/m², which is 0.6 W/m² less than the incoming solar radiation. (That figure is poorly constrained, and not directly measurable; I’ve also seen estimates of 0.7 or 0.8 W/m².) That is their estimate of the "radiation imbalance," which represents warming “in the pipe,” but not yet realized.
If we assume that 2.8 to 3.4 W/m² forcing causes 1°C of warming, then a 0.6 W/m² radiation imbalance represents a nearly negligible 0.17 to 0.22 °C of unrealized warming, in prospect, due to past emissions.
4. Downwelling “back radiation” at the surface, from GHGs in the atmosphere, is estimated as 340.3 W/m². That's about the same as the solar irradiance at TOA, but ≈29% greater than the average amount of solar radiation which makes it to the surface.
Thus, an increase of 1 W/m² in LW IR at the surface from GHGs in the atmosphere has an effect on surface temperatures which is roughly similar to a 1.29 W/m² increase in average solar irradiance at TOA (i.e., a 5.16 W/m² increase in the “solar constant”). (I think the Earth's average surface reflectance is lower for LW IR than for shorter wavelengths, which is why I wrote “roughly similar” rather than “equal.”)
If the usual CO2 forcing estimate of 3.7 ±0.4 W/m² per doubling were correct, then Feldman et al should have seen at least 29% more than that from LW IR back radiation at the surface, i.e. 4.8 ±0.5 W/m² per doubling. But they didn't. Instead, they measured only 2.40 ±0.72 W/m² per doubling. That suggests that the usual CO2 forcing estimate is at least ((4.8-0.5)/(2.40+0.72))-1 = 38% too high, confirming Happer’s calculation.