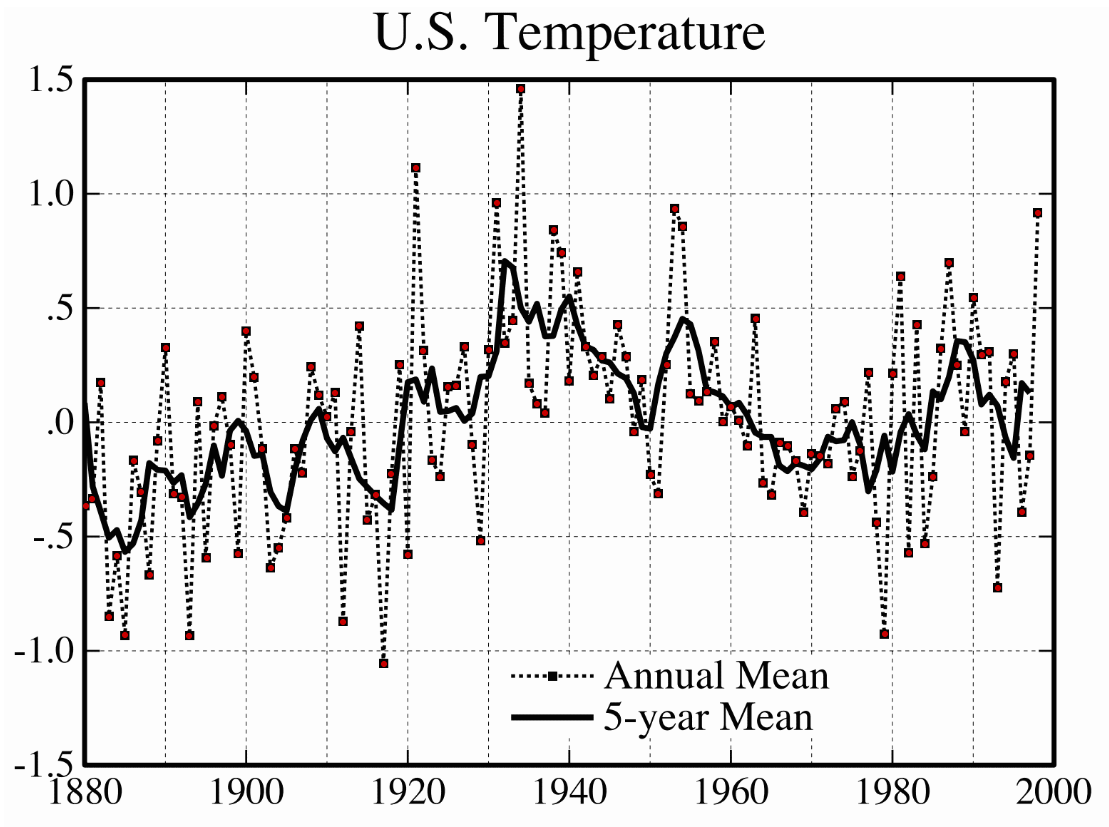
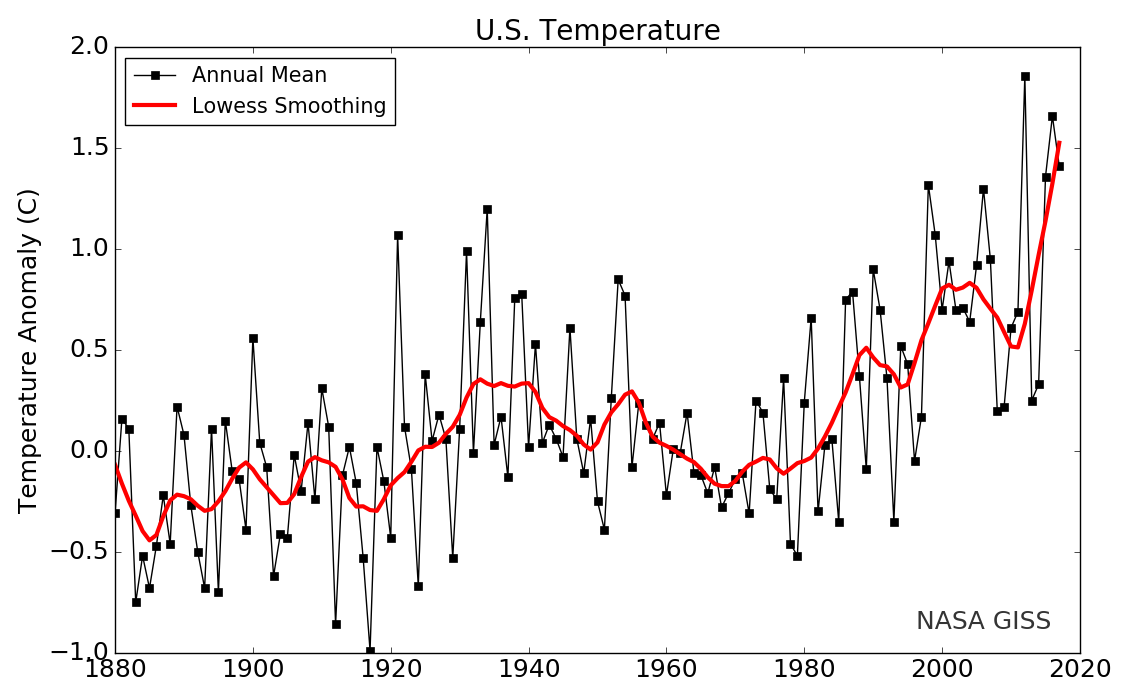
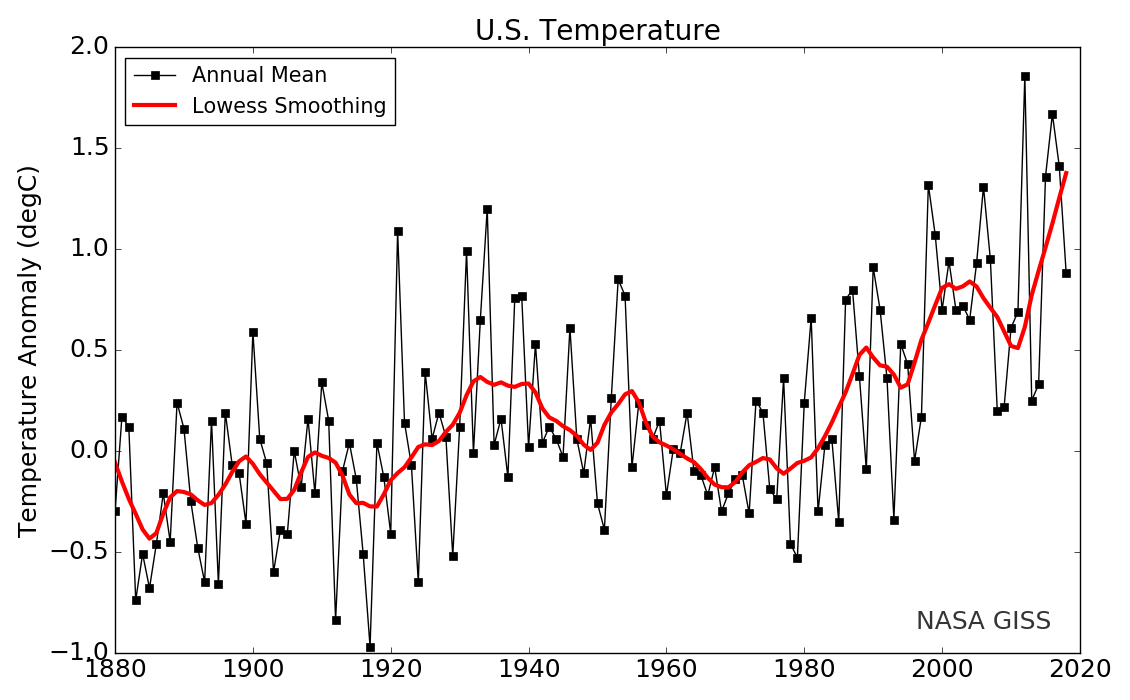
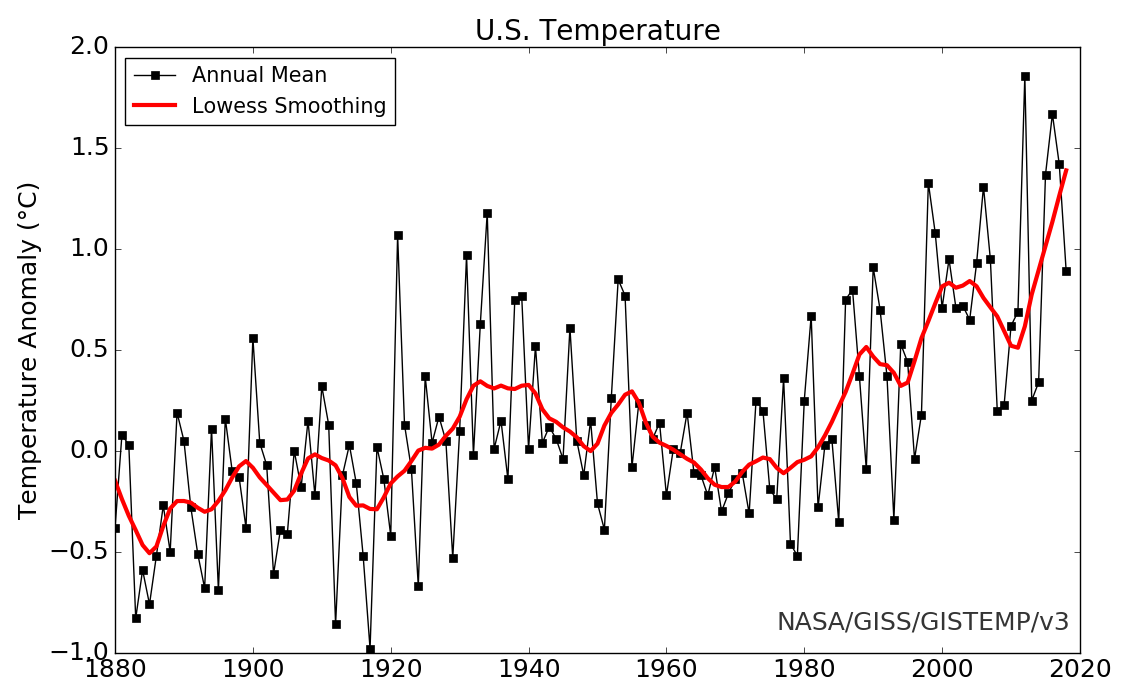
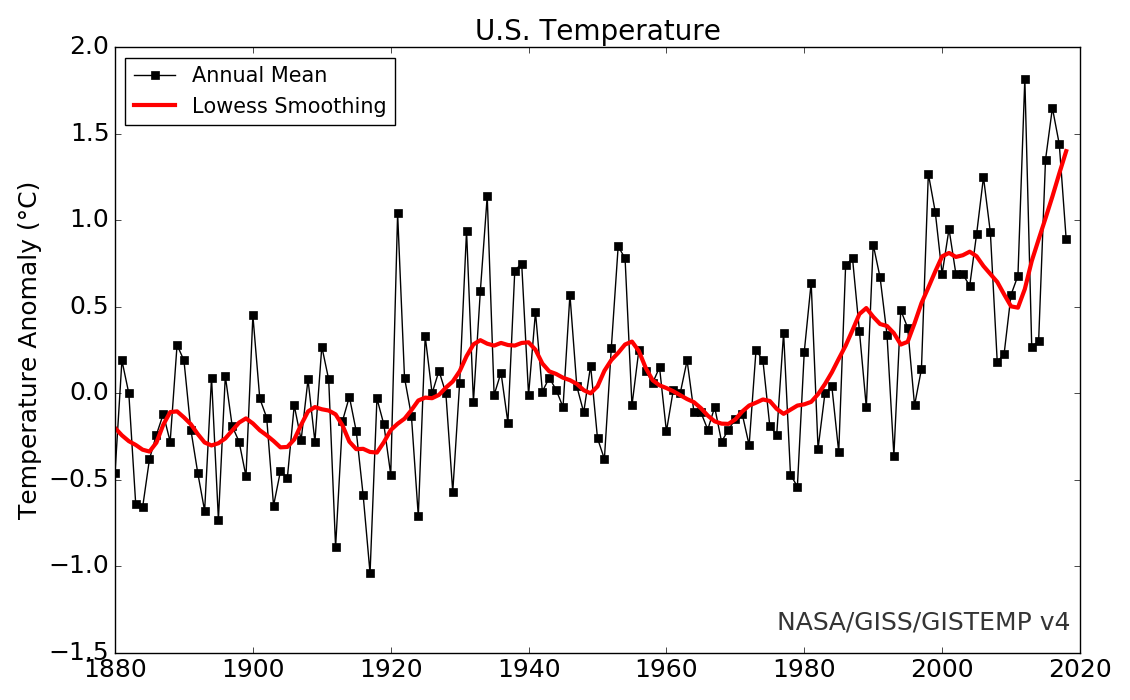
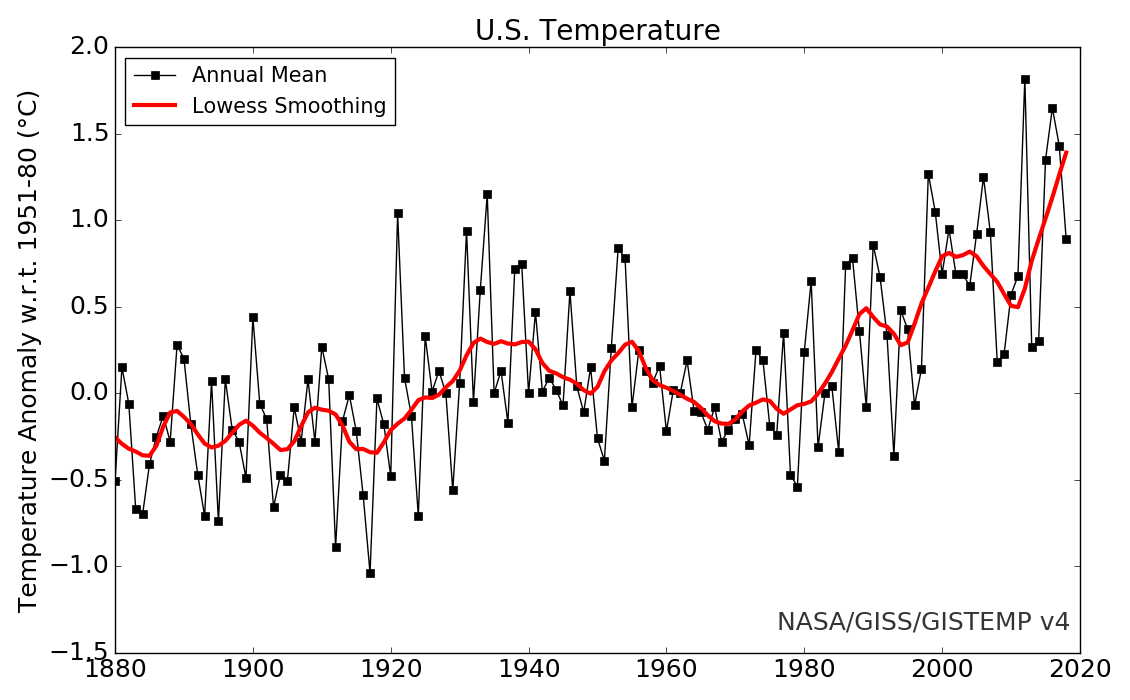
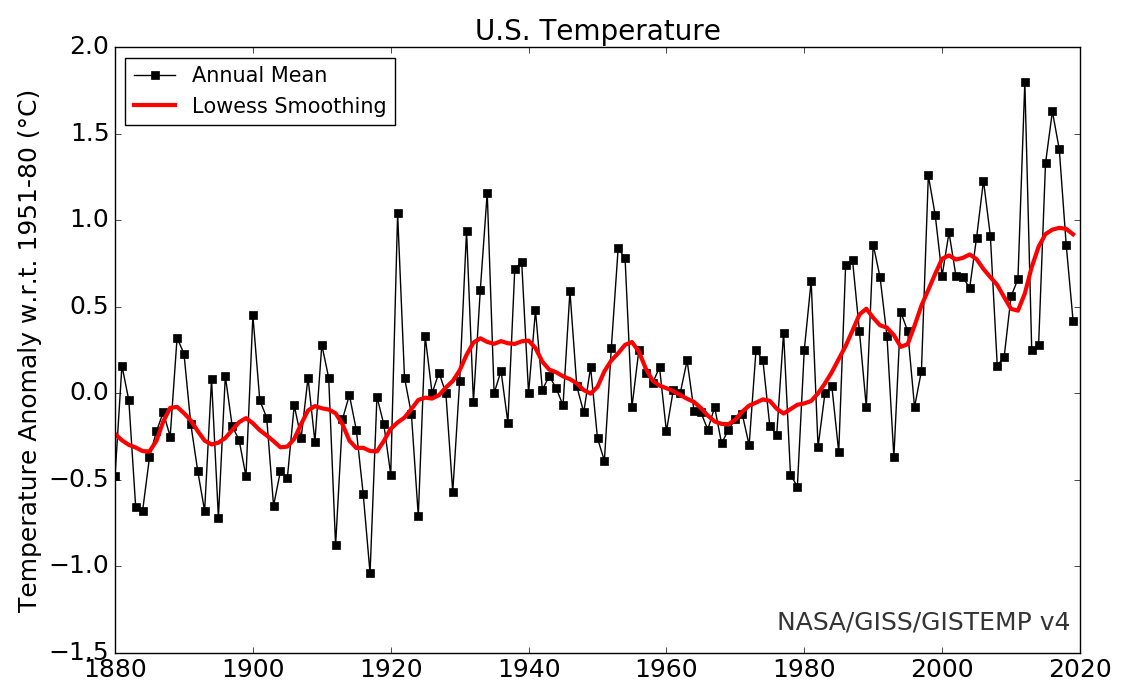
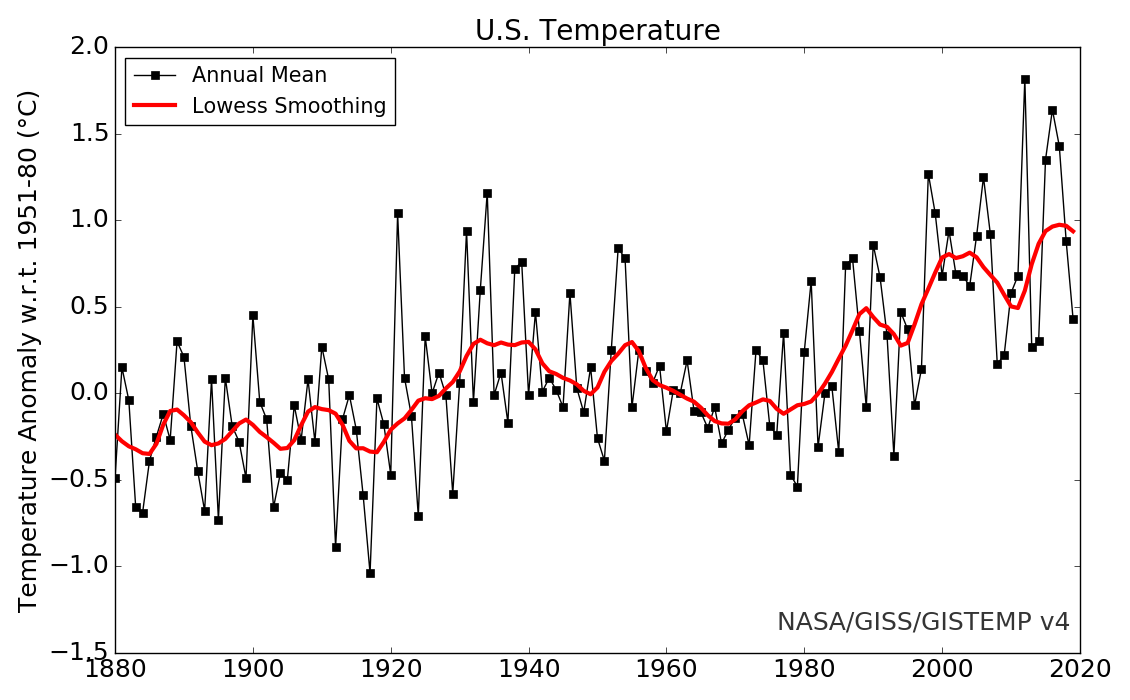
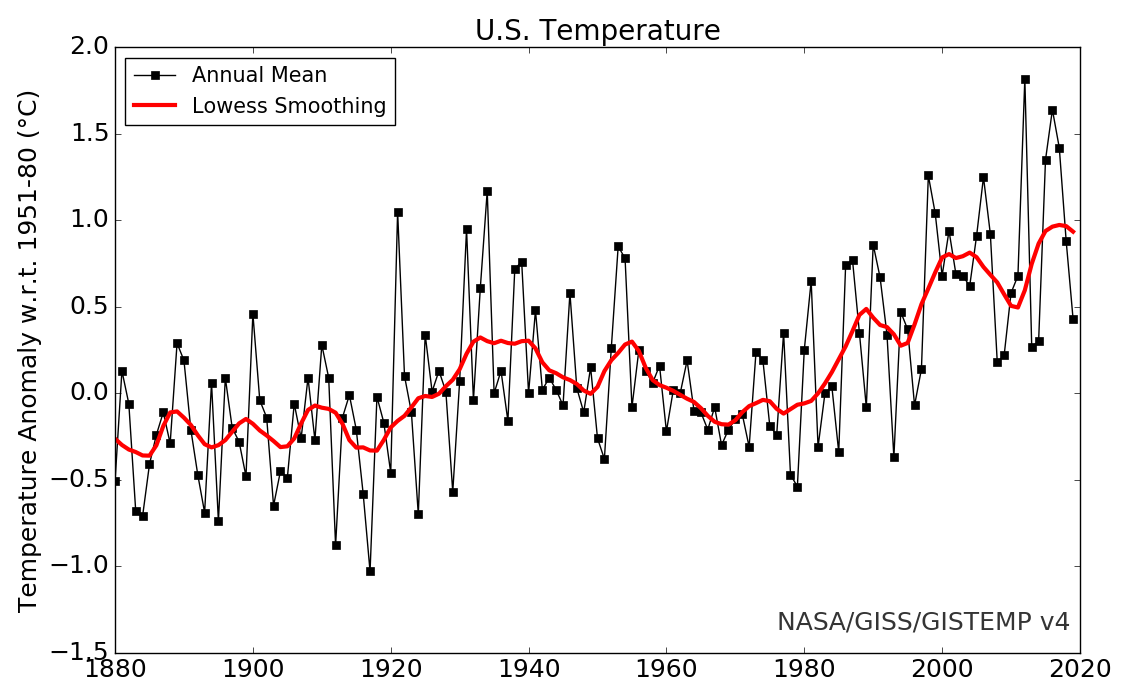
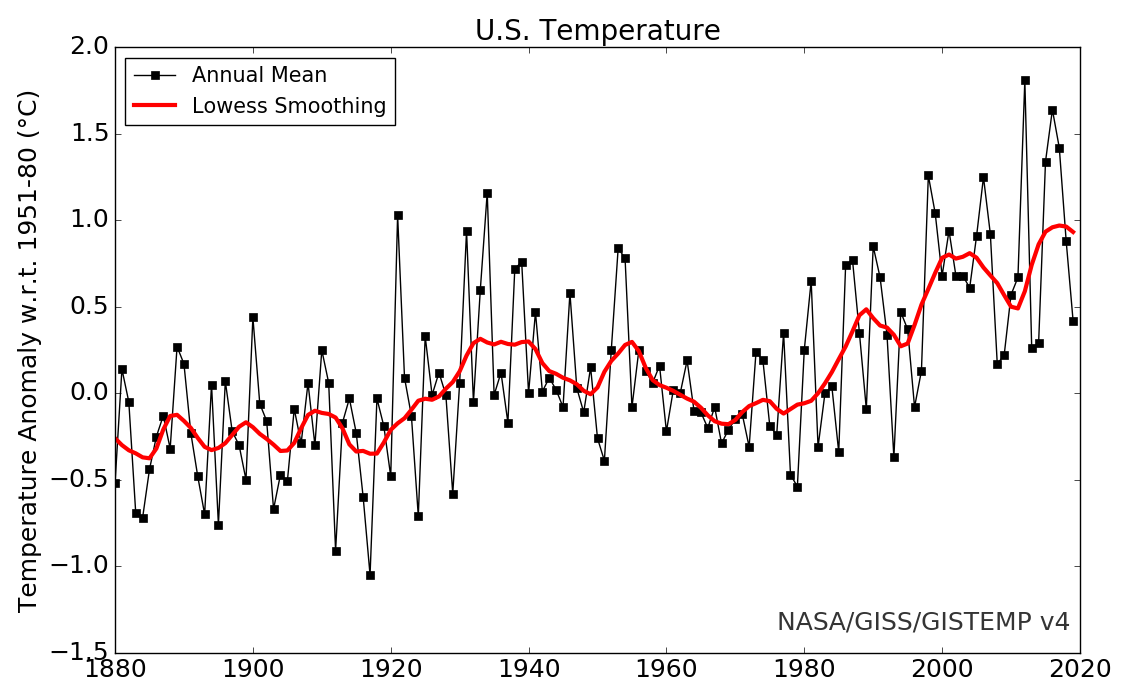
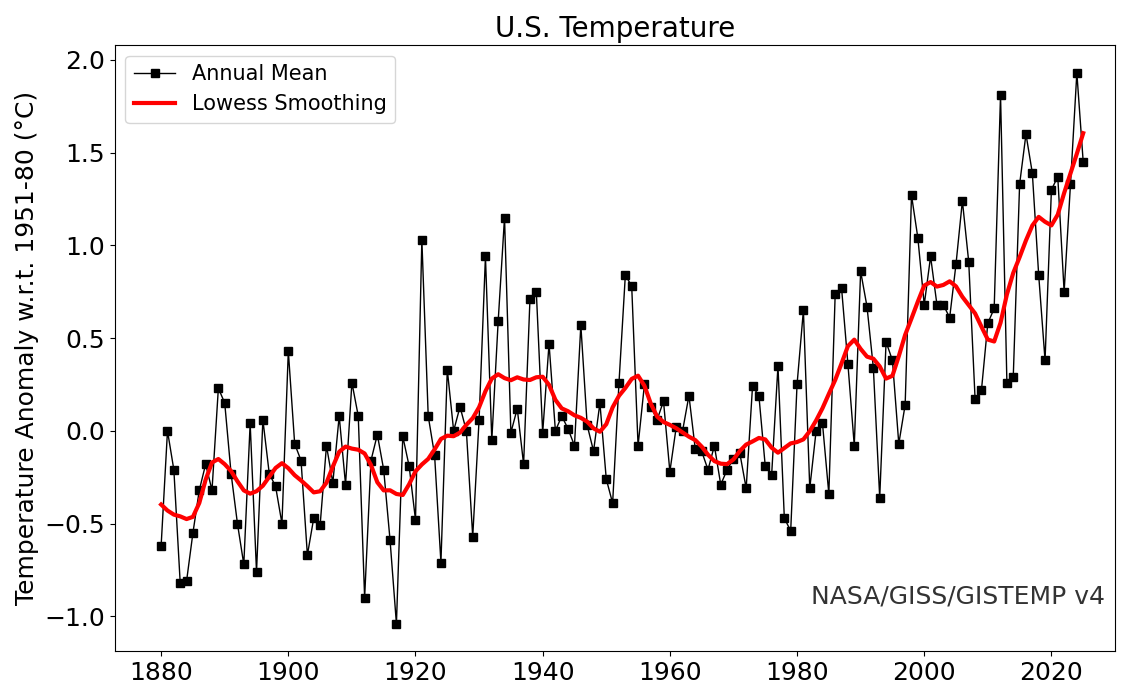
NASA GISS "Fig.D" U.S. 48-State Surface Air Temperature Anomaly
Even back in 2000-2001 NOAA NCDC and/or NASA GISS were busily revising the U.S. surface temperature data, to shrink the
1930s temperature spike and increase post-WWII warming. John Daly created this blink comparator to illustrate what was going on:
 Since NOAA & NASA apparently don't believe in version control, I have been archiving old versions of the data and
graphs.
Since NOAA & NASA apparently don't believe in version control, I have been archiving old versions of the data and
graphs.
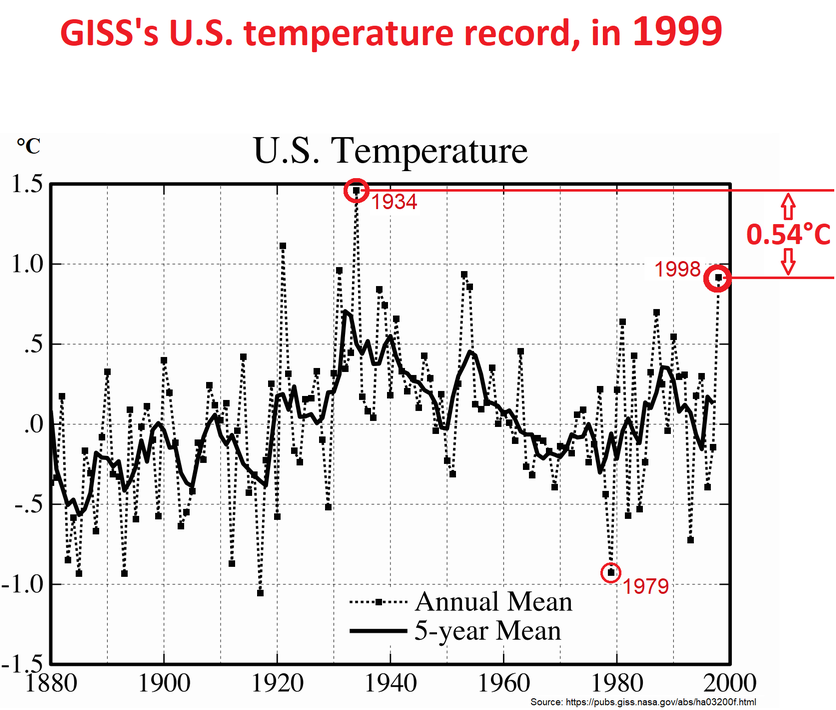
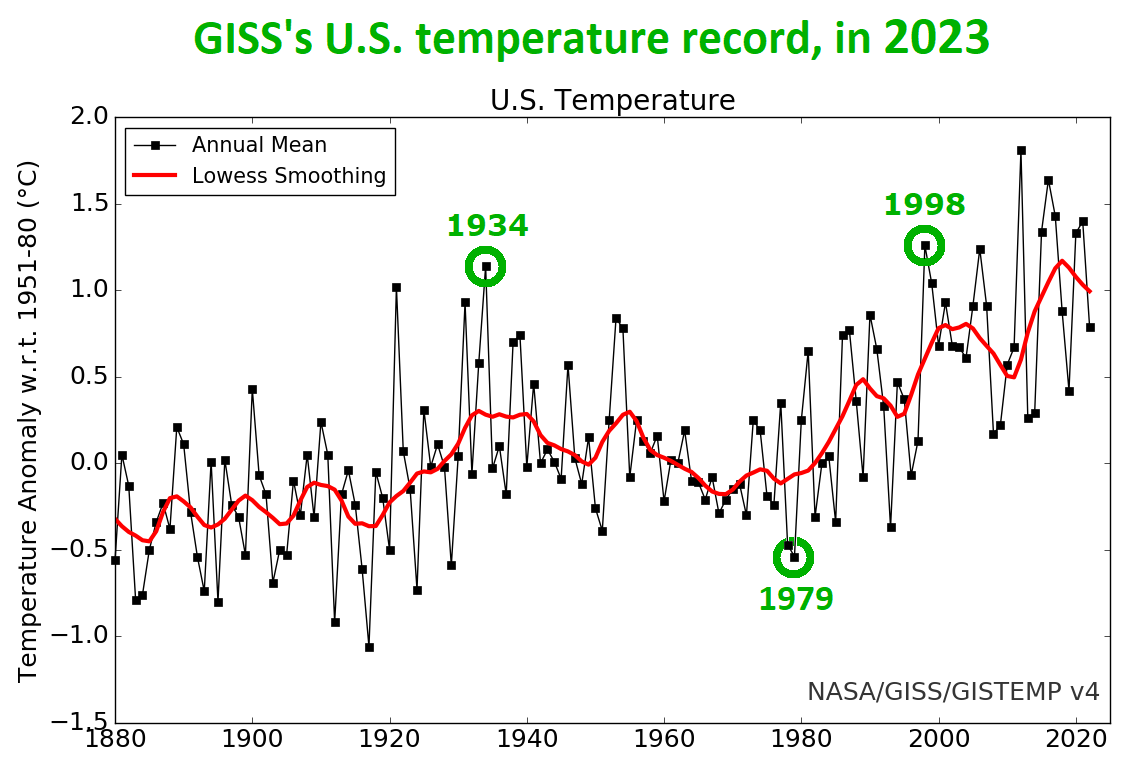

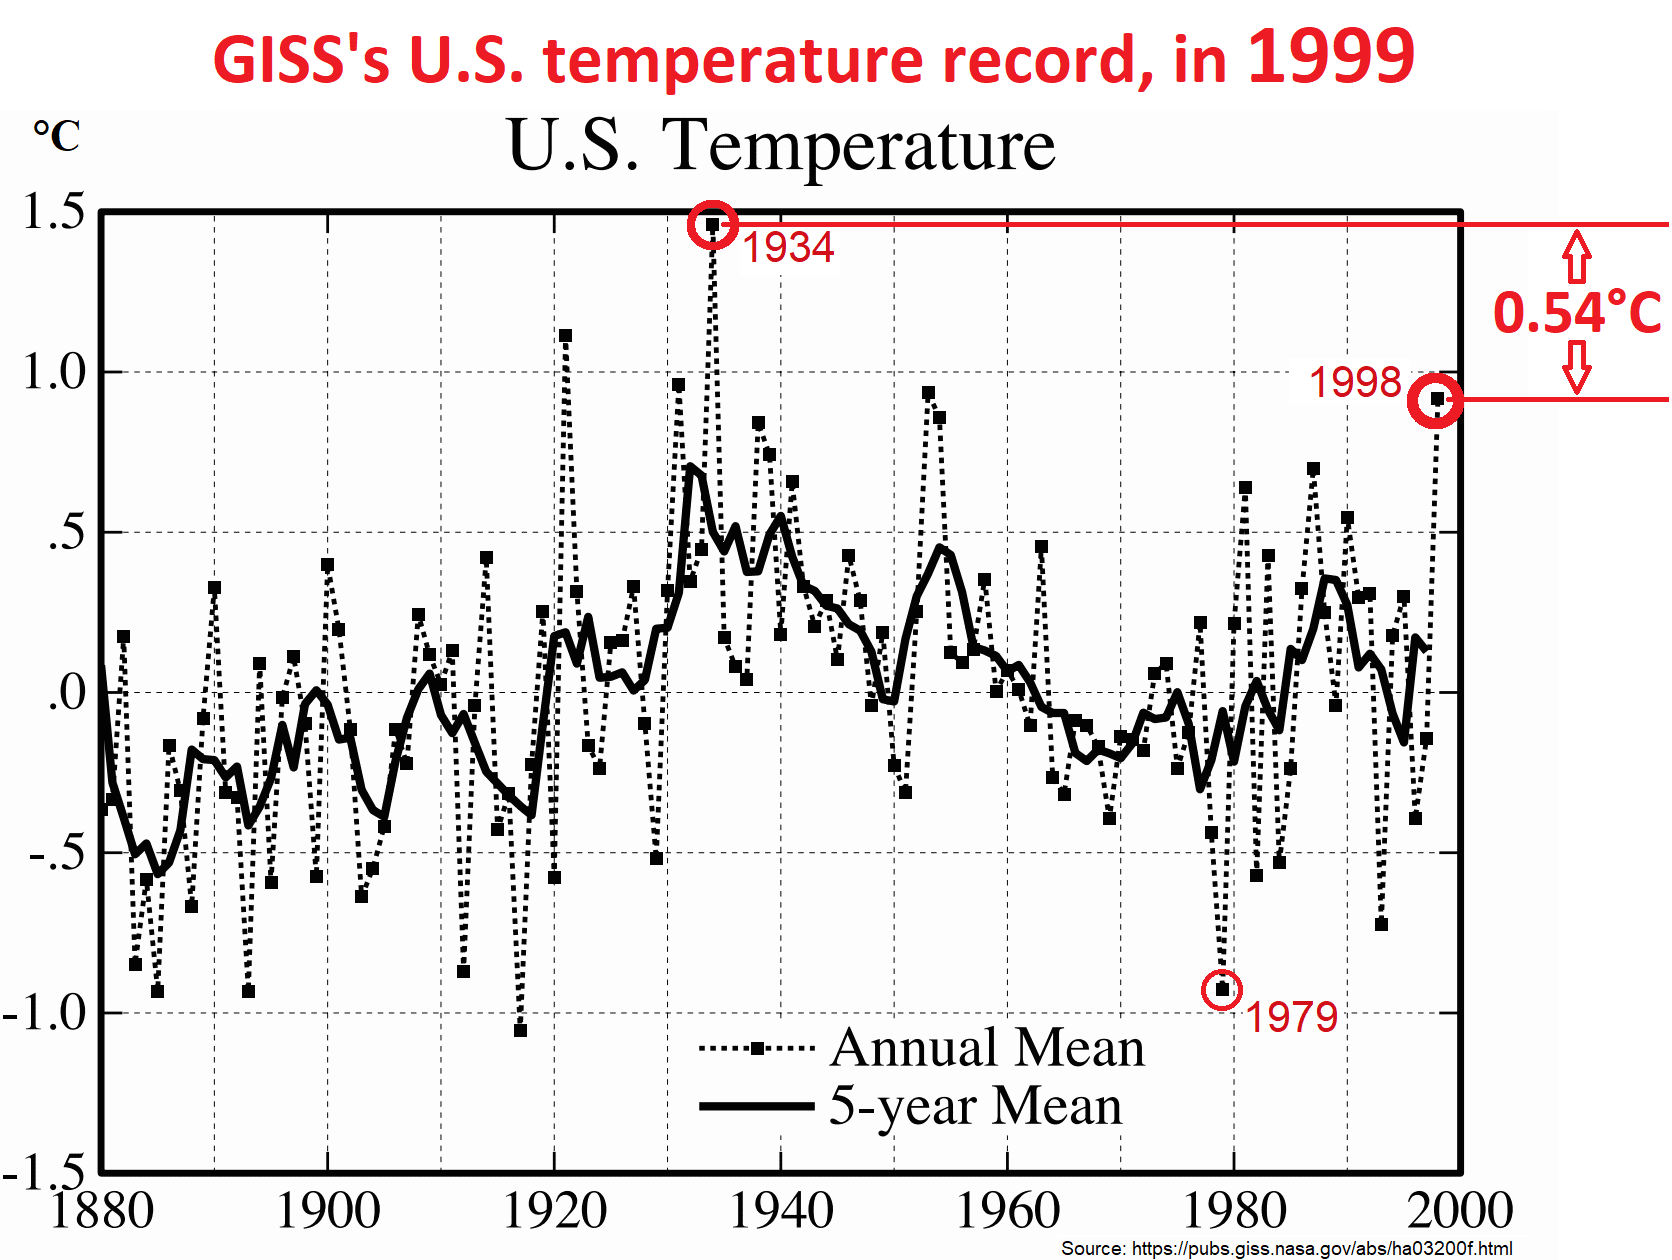
In 1999, they showed 1934 as 0.54 °C warmer than 1998. But now they show 1934 as 0.12 °C cooler than 1998. They cooled 1934 and warmed 1998 by a combined total of 0.66 °C, conveniently “straightening the hockey stick handle,” considerably.
That's mostly the same measurements, but there is one slight difference between what is depicted in Hansen's 1999 graph (on the left) and what is shown in the 2023 graph (on the right). In 1999 they used “meteorological years” (Dec-to-Nov), and now they use calendar years (Jan-to-Dec). Using meteorological years shifts December data to the following year. (They also use LOWESS smoothing, now, for the smoothed trace, but that doesn't make much difference.)
Note: GISS's v3 graphs (2013-12-31 through 2018-09-14) are in .gif format. If they display with a black background in your web browser, try using a different web browser, such as Mozilla Firefox.
| Date | Data file | Sources † † |
|---|---|---|
| 1999-06? | FigD.txt,
graph, digitized graph, & FigD.xls | Reconstructed from Hansen, et al (1999) Figure 6 (or here), using WebPlotDigitizer |
| 2000-06-?? | FigD.txt | 1(D), 2(D) |
| 2001-02-14 | FigD.txt | 1(A), 2(D), 3(D), ... |
| 2003-06-28 | Fig.D.txt | 1(A), ... |
| 2004-03-04 | Fig.D.txt | 1(A), ... |
| 2005-03-31 | Fig.D.txt | 1(A), ... |
| 2006-01-10 | Fig.D.txt | 1(A), ... |
| 2006-06-?? | Fig.D.txt | 1(D) |
| 2007-02-01? | Fig.D.txt | 1(D) |
| 2007-02-28? | new.Fig.D.txt | 1(D), 2(D) |
| 2007-08-??‡ ‡ | Fig.D.txt | 1(A), ... |
| 2007-08-13‡ ‡ | new.Fig.D.txt | personal communication (M) |
| 2007-08-31 | Fig.D.txt | 1(D), 2(A), ... |
| 2008-01-20 | Fig.D.txt | 1(A), ... |
| 2009-01-30 | Fig.D.txt | 1(A), ... |
| 2009-11-23 | Fig.D.txt | 1(A), ... |
| 2010-01-24 | Fig.D.txt | 1(A) |
| 2010-02-24 | Fig.D.txt | 1(A), ... |
| 2011-02-07 | Fig.D.txt | 1(A) |
| 2011-03-10 | Fig.D.txt | 1(A) |
| 2011-04-26 | Fig.D.txt | 1(A) |
| 2011-06-11 | Fig.D.txt | 1(A) |
| 2011-07-12 | Fig.D.txt | 1(A) |
| 2011-08-11† | Fig.D.txt | 1(A), ... |
| 2012-01-02 | Fig.D.txt | 1(A), ... |
| 2012-04-26 | Fig.D.txt | 1(A) |
| 2012-07-02 | Fig.D.txt | 1(A) |
| 2012-07-13 | Fig.D.txt | 1(A) |
| 2012-08-20† | Fig.D.txt | 1(A) |
| 2012-10-03 | Fig.D.txt | 1(A) |
| 2013-12-31‡ | Fig.D.txt & graph | http:// |
| 2014-01-23‡ | Fig.D.txt & graph | ″ ″ |
| 2014-03-01‡ | Fig.D.txt & graph | ″ ″ |
| 2014-05-10‡ | Fig.D.txt & graph | ″ ″ |
| 2014-05-21‡ | Fig.D.txt & graph | ″ ″ |
| 2014-06-24‡ | Fig.D.txt & graph | ″ ″ |
| 2014-07-29‡ | Fig.D.txt & graph | ″ ″ |
| 2014-08-25‡ | Fig.D.txt & graph | ″ ″ |
| 2014-10-05‡ | Fig.D.txt & graph | ″ ″ |
| 2014-11-15‡ | Fig.D.txt & graph | ″ ″ |
| 2014-12-16‡ | Fig.D.txt & graph | ″ ″ |
| 2015-01-27‡ | Fig.D.txt & graph | ″ ″ |
| 2015-02-24‡ | Fig.D.txt & graph | ″ ″ |
| 2015-04-29‡ | Fig.D.txt & graph | ″ ″ |
| 2015-06-30 | Fig.D.txt & graph | Fig.D.txt(A) (& graph) |
| 2015-07-24‡ | Fig.D.txt & graph | http:// |
| 2015-08-27‡ | Fig.D.txt & graph | ″ ″ |
| 2015-10-27‡ | Fig.D.txt & graph | ″ ″ |
| 2015-11-30‡ | Fig.D.txt & graph | ″ ″ |
| 2015-12-17‡ | Fig.D.txt & graph | ″ ″ |
| 2016-01-23‡ | Fig.D.txt & graph | ″ ″ |
| 2016-02-20‡ | Fig.D.txt & graph | ″ ″ |
| 2016-03-11‡ | Fig.D.txt & graph | ″ ″ |
| 2016-04-27‡ | Fig.D.txt & graph | ″ ″ |
| 2016-05-16‡ | Fig.D.txt & graph | ″ ″ |
| 2016-06-10 | Fig.D.txt & graph | ″ ″ |
| 2016-07-13 | Fig.D.txt & graph | ″ ″ |
| 2016-08-12 | Fig.D.txt & graph | ″ ″ |
| 2016-09-09 | Fig.D.txt & graph | ″ ″ |
| 2016-10-13 | Fig.D.txt & graph | ″ ″ |
| 2017-04-14 | Fig.D.txt & graph | ″ ″ |
| 2017-05-15 | Fig.D.txt & graph | ″ ″ |
| 2017-07-14 | Fig.D.txt & graph | ″ ″ |
| 2017-08-15 | Fig.D.txt & graph | ″ ″ |
| 2017-10-16 | Fig.D.txt & graph | ″ ″ |
| 2017-11-14 | Fig.D.txt & graph | ″ ″ |
| 2017-12-13 | Fig.D.txt & graph | ″ ″ |
| 2018-01-12 | Fig.D.txt & graph | ″ ″ |
| 2018-02-09 | Fig.D.txt & graph | ″ ″ |
| 2018-03-13 | Fig.D.txt & graph | ″ ″ |
| 2018-04-13 | Fig.D.txt & graph | ″ ″ |
| 2018-05-11 | Fig.D.txt & graph | ″ ″ |
| 2018-06-14 | Fig.D.txt & graph | ″ ″ |
| 2018-07-12 | Fig.D.txt & graph | ″ ″ |
| 2018-08-15 | Fig.D.txt & graph | ″ ″ |
| 2018-09-14 | Fig.D.txt & graph | (final version 3) |
| 2018-12-14 | Fig.D.txt & graph | https:// |
| 2019-02-03 | Fig.D.txt & graph | ″ ″ |
| 2019-02-20 | Fig.D.txt & graph | ″ ″ |
| 2019-03-15 | Fig.D.txt & graph | ″ ″ |
| 2019-04-23 | Fig.D.txt & graph | ″ ″ |
| 2019-05-13 | Fig.D.txt & graph | ″ ″ |
| 2019-07-02 | Fig.D.txt & graph | ″ ″ |
| 2019-07-12 | Fig.D.txt & graph | ″ ″ |
| 2019-08-14 | Fig.D.txt & graph | ″ ″ |
| 2019-09-11 | Fig.D.txt & graph | ″ ″ |
| 2019-10-11 | Fig.D.txt & graph | ″ ″ |
| 2019-11-14 | Fig.D.txt & graph | ″ ″ |
| 2019-12-13 | Fig.D.txt & graph | ″ ″ |
| 2020-01-02 | Fig.D.txt & graph | ″ ″ |
| 2020-01-09 | Fig.D.txt & graph | ″ ″ |
| 2020-02-13 | Fig.D.txt & graph | ″ ″ |
| 2020-03-09 | Fig.D.txt & graph | ″ ″ |
| 2020-04-13 | Fig.D.txt & graph | ″ ″ |
| 2020-05-12 | Fig.D.txt & graph | ″ ″ |
| 2020-06-10 | Fig.D.txt & graph | ″ ″ |
| 2020-07-10 | Fig.D.txt & graph | ″ ″ |
| 2020-08-13 | Fig.D.txt & graph | ″ ″ |
| 2020-09-11 | Fig.D.txt & graph | ″ ″ |
| 2026-03-25 | Fig.D.txt & graph | ″ ″ |
| all | FigD_all.zip | all of the above |
| final v3 | data & graph | |
| current v4 | data & graph | |
|
† indicates evidence of time travel: the 2011-08-11
and 2012-08-20 data files each have an extra line of data at the end,
showing the year's average temperature anomaly, calculated in August
of that same year!
‡ 2013-12-31 through 2016-05-17 data files were manually downloaded, because GISS had configured their web server to block access by archiving tools like webcitation. (They were also blocking archive.org, but as of June 2014 they've apparently ceased blocking it.) Wget also appeared to cease working, but that turned out to be because they now require the HTTP/1.1 protocol, which old versions of wget didn't support. After I upgraded my copy of Wget to version 1.16, it worked for about a year. Then, for most of April, 2016, GISS accidentally banned access to their web site from my IP address, and I had to access it via a proxy server; they unblocked it 4/27/2016. † † In the "Sources" column (D) means from John Daly & Jerry Brennan, (A) means from archive.org, and (M) means from Stephen McIntyre. In many cases, identical files were saved on multiple dates. The dates shown in this table are the dates of the oldest known copies. For the Daly/Brennan files, only the month was recorded, but in a few cases there is reason to believe it was from near the beginning or end of the month, and in such cases I used the first or last day of the month, respectively. The dirty tricks which NASA GISS pulled to prevent archiving of this data are discussed on Tony Heller's blog site, here (and in my comments here, here and here). It is shocking. I asked the "Climate Science Rapid Response Team" to help me locate the old data, and to explain the alterations which had added so much apparent "warming" to the U.S. surface temperature record. They were unable to do so, but they did direct me to some interesting material (some of which made me queasy); see also here. For more discussion of the sources of this data, see https://sealevel.info/GISS_FigD.html. ‡ ‡ The 2007-08-?? version is probably older than the 2007-08-13 version. The confusion is due in part to the fact that GISS had two versions on their server, "Fig.D.txt" and "new.Fig.D.txt," but archive.org never saved any copies of new.Fig.D.txt. | ||