Note: For the full collection of archived data files and NASA GISS-generated "Fig.D" graphs see: https://sealevel.info/GISS_FigD/
NASA GISS "Fig.D" U.S. 48-State Surface Air Temperature Anomaly
Dear Steve,
I love your
article showing the progression of the NCDC and/or GISS
"adjustments" to the U.S. surface air temperature data. However,
what you called the "1999" version of the NASA "FigD.txt"
(a/k/a Fig.D.txt)
data is actually a version from mid-2000. Based on the file's name and
contents I'm pretty sure that John Daly downloaded and saved it in June,
2000. That's why it includes the full-year average for 1999, and also why
it doesn't match the (earlier) graph found in Hansen's August, 1999
article and paper (doi:10.1029/1999JD900835).
These are all the versions of John Daly's saved copies of the GISS
"FigD.txt" or "Fig.D.txt"
data file which I have been able to find on his web site:
"Contiguous 48 U.S. Surface Air Temperature Anomaly (C)"
- http://www.john-daly.com/
GISSUSAT.006 June, 2000 - http://www.john-daly.com/
usatemps.006 June, 2000 (identical to GISSUSAT.006) - http://www.john-daly.com/
GISSUSAT.103 March, 2001 - http://www.john-daly.com/
usatemps.103 March, 2001 (identical to GISSUSAT.103) - http://www.john-daly.com/
usatemps.408 August, 2004 - http://www.john-daly.com/
usatemps.606 June, 2006 - http://www.john-daly.com/
usatemps.702 February, 2007 (early) - http://www.john-daly.com/
GISSUSAT.702 February, 2007 (late) - http://www.john-daly.com/
usatemps.7-2 February, 2007 (late) (identical toGISSUSAT.702) - http://www.john-daly.com/
GISSUSAT.708 August, 2007
There might be more, but if so I didn't find them. I've cc'd Jerry
Brennan; perhaps he can check.
Note that John died on January 29, 2004, so only
the two oldest versions could have been downloaded by him. I don't know
who downloaded the 2004-2007 versions of the data file and put them on
John's site. My guess is that it was Jerry Brennan, who is the
current webmaster of John's site, or perhaps John's widow, Amy, or his
daughter, Rachel.
The data files have apparently resided on NASA's servers in six
locations, over the years:
- http://www.giss.nasa.gov/data/update/gistemp/graphs/FigD.txt (and
some archive.org copies)
- http://www.giss.nasa.gov/data/update/gistemp/graphs/Fig.D.txt (and some
archived versions [h/t Steve Goddard])
- http://data.giss.nasa.gov/update/gistemp/graphs/FigD.txt (and archive.org copies, theoretically)
- http://data.giss.nasa.gov/gistemp/graphs/Fig.D.txt (and
many archive.org versions)
- http://data.giss.nasa.gov/gistemp/graphs_v2/Fig.D.txt (and
one archive.org
copy)
- http://data.giss.nasa.gov/gistemp/graphs_v3/Fig.D.txt (and
a few archive.org
versions)
Note that the "February, 2007 (early)" version is identical to the
"March, 2001" version for the years 1880 through 1961, but the
"February, 2007 (late)" version differs considerably from both of them,
all the way back to 1880.
Even back in 2000-2001 NOAA NCDC and/or NASA GISS were busily revising
the data to shrink the 1930s temperature spike and increase post-WWII warming.
John Daly created this blink comparator to illustrate what was going on:
big
version: http://www.john-daly.com/giss-wig.gif
small version:
It compares the June, 2000 version of the data to the March, 2001
version. Because John's "before" version was the June, 2000 version, I
suspect that is the earliest data file he had.
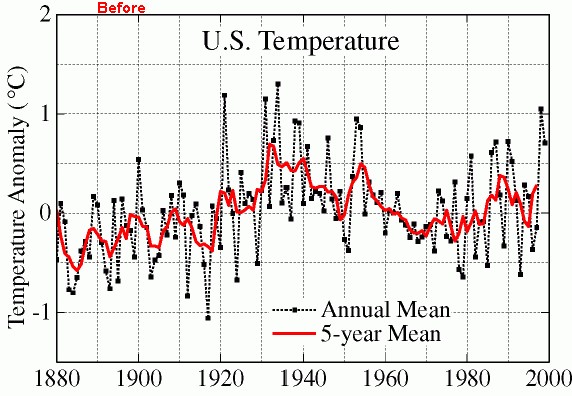
Recovery of missing 1999 data Unfortunately, NASA GISS seems to have "disappeared" the 1999 version of the data file, which was depicted in Hansen's graph. (They also used robots.txt to prevent the data from being archived.)
In late 2011
I asked the CSRRT (Climate Science Rapid Response Team) to help me
find that lost data, but they were stumped. Here's the conversation:
So I've reconstructed the lost 1999 data file by digitizing the
annual temperatures from Hansen's 1999 graph.
My first attempt to reconstruct the 1999 version of the data was
from this little graph, in which
1934 was shown as 0.6 °C warmer than 1998. The graph's small size,
and the fact that the "5-year mean" is opaque and covers up several data
points, made it difficult. I enlarged it to 500%, converted the red
5-year mean to green with Irfanview (to contrast with red digitized data
points), and used WebPlotDigitizer to manually digitize the 119 data
points, which are shown as red dots here:
small version:
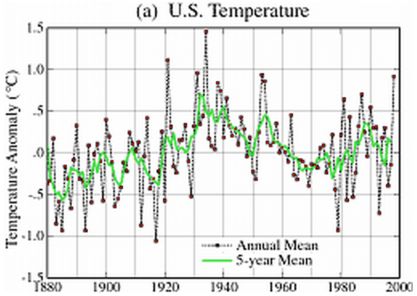
However, I subsequently noticed that the 1999 Hansen JGR
paper has a
high-resolution B&W version of the same graph, as "Figure 6" on p.37.
Here it is:
small version:
So I digitized that version. The digitized points are indicated in red
here:
The resulting reconstructed 1999 FigD.txt data file is here:
The corresponding Excel spreadsheet (in which the temperatures have
not been rounded to the nearest 0.01 °C) is here:
All of the temperature values in the reconstructed data files should be
within ± 0.01 °C of those in the lost
1999 data file, except for the 1880 and 1881 "5-year mean" temperatures,
which are rough estimates made by eyeballing the graph (since the 1878
& 1879 temperatures weren't reported).
The version from the low-resolution graph is not as
accurate, so don't use it:
Warmest regards,
Dave