SeaLevel.info
Average Rate of Sea-Level Rise
Synopsis ↑
Sea-level
 is not rising everywhere. The measured rate of coastal sea-level change varies from
-17.59 mm/yr at Skagway, Alaska
to +9.39 mm/yr at Kushiro, Japan.
is not rising everywhere. The measured rate of coastal sea-level change varies from
-17.59 mm/yr at Skagway, Alaska
to +9.39 mm/yr at Kushiro, Japan.
At about one-third of the world's tide gauges, vertical land motion (subsidence or uplift) affects local sea-level more than global sea-level change does.
The global average rate of sea-level change, as measured by the world's best long-term coastal tide gauges, is just under +1.5 mm/yr (about 6 inches per century), and it is not significantly accelerating.
Acceleration ↑
The most
 important thing to know about sea-level is that, although sea-level trends vary from one location to
another (mainly due to differences in vertical land motion), the average trend is approximately linear.
important thing to know about sea-level is that, although sea-level trends vary from one location to
another (mainly due to differences in vertical land motion), the average trend is approximately linear.
In other words, there's been little or no acceleration in rate of sea-level rise since the 1920s or before, at the vast majority of locations.
During that time period, atmospheric levels of CO2 and CH4 have increased dramatically, but they have not detectably affected sea-level.
“Even though the human influence on climate was much smaller in the past, the models do not account for the fact that the rate of global sea-level rise 70 years ago was as large as what we observe today.”
Dr. Steven Koonin, former Undersecretary for Science (Obama Administration)
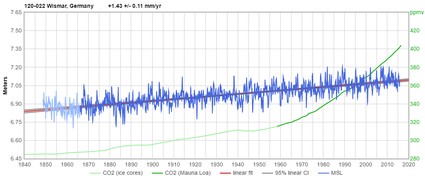
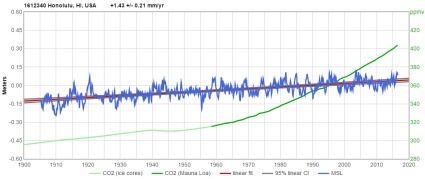
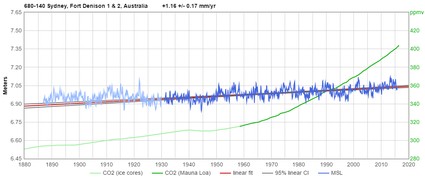
Representative tide gauges ↑
These are among the highest-quality measurement records of coastal sea-level in the world. Blue is measured sea-level, red is linear sea-level trend, and green is global atmospheric CO2 level.
As you can see, the sea-level trends they've measured are almost perfectly linear since the 1920s or before,
with rates averaging less than 1.5 mm/year.
(Click the graphs for larger versions.)
Atlantic/Baltic:
North Pacific:
Southern hemisphere:
Satellite altimetry ↑
Some sources quote much higher rates, sometimes as high as 3.4 mm/yr (13 inches per century), based on satellite altimetry measurements of sea-level. But using satellite altimetry to estimate global average sea-level change, rather than using coastal sea-level measurements from tide gauges, is a mistake.
Most fundamentally,
 satellite altimeters measure the wrong thing.
Their measurements
are distorted by "sea-level rise" caused by thermal expansion when the upper layer of the ocean warms. But that is a strictly
local effect, which doesn't affect the quantity of water in the oceans, and doesn't affect sea-level elsewhere (e.g., at the coasts).
satellite altimeters measure the wrong thing.
Their measurements
are distorted by "sea-level rise" caused by thermal expansion when the upper layer of the ocean warms. But that is a strictly
local effect, which doesn't affect the quantity of water in the oceans, and doesn't affect sea-level elsewhere (e.g., at the coasts).
Sea-level rise only matters at the coasts, but satellite altimeters are incapable of measuring sea-level at the coasts. They can only measure sea-level in the open ocean. Only tide gauges measure sea-level at the coasts, where it matters.
Also, data from tide gauge measurements of sea-level are much higher quality than satellite altimetry measurements. The satellite measurements of sea-level are of dubious reliability, and vary considerably from one satellite to another.
Also, we have reliable, near-continuous tide-gauge records of sea-level measurements which are nearly ten times as long as the combined satellite measurement record, and twenty times as long as any single satellite measurement record.
NOAA says that the average rate of MSL (mean sea-level) rise is 1.7-1.8 mm/yr. The difference between that figure and the 1.4-1.5 mm/yr calculated average from tide gauge measurements is apparently NOAA's addition of a model-derived GIA adjustment to the calculated average, to attempt to account for Post-Glacial Rebound (PGR). My guess is that they're using Univ. of Toronto Prof. Richard Peltier's figures.
Prof. Peltier estimates that meltwater load from the melting of the great ice sheets during the last deglaciation (~7.5k to ~15k years ago) is causing the ocean basins to sink and broaden fast enough to cause a 0.3 mm/yr fall in global sea-level, absent other factors. (There are several other groups of researchers doing similar work; this paper reviews and compares the leading GIA models, with emphasis on their handling of Antarctica.)
Unfortunately, model-derived GIA figures are of limited utility for estimating vertical land motion, because of both the limitations of the models, and the fact that they cannot account for local effects, such as subsidence due to groundwater pumping, oil & gas extraction, etc.
Even so, for water mass budget calculations and similar uses, it is reasonable to add GIA (est. 0.3 mm/yr) to measured rates of sea-level. The Univ. of Colorado Sea Level Research Group says:
“We apply a correction for GIA because we want our sea level time series to reflect purely oceanographic phenomena. In essence, we would like our GMSL time series to be a proxy for ocean water volume changes. This is what is needed for comparisons to global climate models, for example, and other oceanographic datasets.”
However, when GIA is added to measurements, the resulting sum (~1.5 mm/yr + 0.3 mm/yr = ~1.8 mm/yr, in the case of coastal tide-gauge measurements) is not truly sea-level, and is not useful for projecting sea-level for coastal planning. It's an attempt to calculate what the rate of sea-level rise would be, were it not for the hypothesized sinking of the ocean floor.
Unfortunately, the IPCC, NOAA, and many authors add that adjustment and erroneously report the sum as if it were the actual rate of sea-level rise.
Tide Gauges ↑

NOAA has done linear regression analysis on sea-level measurements (relative sea-level) from 225 long term tide gauges around the world, which have data spanning at least 50 years (plus some with shorter records, a total of 375 locations).
(Note: the literature indicates that at least 50-60 years of data are needed to determine a robust long term sea-level trend from a tide gauge record.)
It is important to realize that there's been no sign of any acceleration (increase in rate) in
 most of those measurement records for more than three-quarters of a century.
The rate of measured sea-level rise (SLR) varies from -17.59 mm/yr at Skagway, Alaska, to +9.39 mm/yr at Kushiro, Japan. 197 of 225 stations (87.6%) have recorded less than 3.3 mm/yr sea-level rise. At 47 of 225 stations (20.9%) sea level is falling, rather than rising. Just 28 of 225 stations (12.4%) have recorded more than 3.3 mm/yr sea-level rise. The average SLR at those 225 gauges is +0.90 mm/yr. The median is +1.41 mm/yr.
That's probably slightly less than the true global average, because a disproportionate number of those 225 stations are northern hemisphere
 for 110 years, with no acceleration. Click for the full-sized graph, from NOAA.") stations affected by PGR (i.e., the land is rising) and the Greenland Gravity Effect.
On the other hand, quite a few long-term tide gauges are substantially affected by subsidence (i.e., the land is sinking), often
due to extraction of water, oil, or natural gas, or due to the location having been elevated with fill dirt which is compacting (like
Galveston).
stations affected by PGR (i.e., the land is rising) and the Greenland Gravity Effect.
On the other hand, quite a few long-term tide gauges are substantially affected by subsidence (i.e., the land is sinking), often
due to extraction of water, oil, or natural gas, or due to the location having been elevated with fill dirt which is compacting (like
Galveston).
I downloaded the two sea-level measurement spreadsheet files (U.S. and global) from
NOAA's page, and combined them into a single
Excel spreadsheet. For ease of sorting, I changed the U.S. station ID numbers by adding an "A-" prefix ("A" for "American").
I also added "average" and "median" lines at the end of the spreadsheet. The average of all 375 NOAA-analyzed stations
is 1.28 mm/yr, and the median is 1.71 mm/yr:
(Scroll to the bottom of the spreadsheet to see the calculated average and median.)
Unfortunately, many of the tide station records in NOAA's expanded list of 375 are too short to be appropriate for measuring
sea-level trends. The literature indicates that at least 50-60 years of data
are needed to establish a robust sea-level trend from a tide station record. But the shortest record in NOAA's list is
Prudhoe Bay, with just
23 years of data (updated in late 2016 to 27 years), and the trend at
Apra Harbor, Guam, is
calculated from just 22 years of data, due to a discontinuity caused by the 8/8/1993 earthquake.
(The text at the top of NOAA's page says,
"Trends with the widest confidence intervals are based on only 30-40 years of data," but that isn't quite correct.)
Approach #1: use only tide stations with at least 50 years of data:
I made a version of the spreadsheet of NOAA-analyzed tide stations in which stations with records shorter than 50 years are omitted. 225 stations remained.
Considering only those 225 tide stations, the average and median rates of MSL rise are 0.90 mm/yr and 1.41 mm/yr, respectively:
(I also tried limiting it to stations with records of at least 60 years, with very similar results: average 0.77 mm/yr, and median 1.37 mm/yr.)
The average (0.90 mm/yr) is probably unrealistically low, due to the disproportionate number of stations in northern Europe which see low or negative rates of measured sea-level rise due to PGR and the Greenland Gravity Effect. The fact that the average is less than the median also suggests that there are a disproportionate number of low-end outliers.
Approach #2: use 50-year stations, but exclude extreme latitudes:
I also tried another approach, in which I excluded the most extreme latitudes. I started with just the "50+ year" stations,
and included only stations within a latitude range of ±45° (i.e., I excluded stations above 45 north or below 45 south).
The resulting average and median for 137 stations were 2.22 mm/y and 2.02 mm/yr, respectively:
That approach largely solves the problem of low-side bias introduced by stations which are affected by PGR (which lowers the calculated average), but it doesn't solve the problem of high-side bias introduced by stations affected by subsidence (which raises the calculated average). So the average (2.22 mm/yr) is probably unrealistically high. The fact that the average is greater than the median also suggests that there are a disproportionate number of high-end outliers.
Approach #3: use 50-year stations, and explicitly exclude outliers:
So I tried another approach, this time explicitly eliminating "outliers."
I did it two ways. In both cases I started with just the "50+ year" stations. The two ways differed in which outliers were excluded.
When I excluded the low and high 35 stations, the result was an average MSL rise of 1.36 mm/yr, and median of 1.41 mm/yr. The fact that the median is larger than the average suggests that it includes more low outliers than high outliers.
So I tried excluding the 40 stations with the lowest rate of sea-level rise (including most of those experiencing falling sea-level), and the 30 stations with the highest rate of sea-level rise (including most of those experiencing severe land subsidence, like Galveston, which is built on sinking fill dirt).
The resulting average and median rates of sea-level rise (calculated from 155
stations) are both 1.48 mm/yr:
Conclusion ↑
That figure, 1.48 mm/year (or “about 1½ mm per year,” which better expresses the uncertainty) is my current best estimate of globally averaged coastal sea-level rise.
At first glance, excluding more low outliers than high outliers might seem to bias the result to the high end. But I think it is justifiable, because of the disproportionate number of northern European and North American stations at locations where the land is rising due to PGR. The fact that the median and average are equal suggests that there aren't disproportionate numbers of either high or low outliers remaining.
Note that 1.48 mm/yr is less than six inches per century.
Note, too, that if you add Peltier's +0.3 mm/yr GIA to that calculated 1.48 mm/yr global average rate of MSL rise, the sum is within NOAA's 1.7-1.8 mm/yr range.
It is not possible to torture the tide-gauge data into yielding a globally averaged rate of sea-level rise anywhere near 3.4 mm/yr.

Dave Burton Aug. 31, 2015 & Feb. 12, 2016.
Revised: Apr. 6, 2016, May 29, 2016, Jan. 14, 2017, Apr. 13, 2017 & Aug. 18, 2020.