Sealevel.info → Data → 8658120
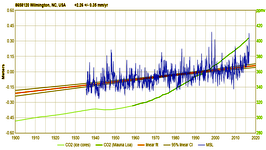
Mean Sea Level at Wilmington, NC, USA (NOAA 8658120, 960-060, PSMSL 396)

Warning! Javascript is disabled, or your web browser
is incompatible with Google Charts, so this page won't
display correctly. Try Google Chrome or Mozilla Firefox.
The mean sea level (MSL) trend at Wilmington, NC, USA is 2.47 mm/year with a 95% confidence interval of ± 0.35 mm/year, based on monthly mean sea level data from 1935 to 2019. That is equivalent to a change of 0.81 feet in 100 years. (R‑squared = (?))
The plot shows the monthly mean sea level without the regular seasonal fluctuations due to coastal ocean temperatures, salinities, winds, atmospheric pressures, and ocean currents. By default, the long-term linear trend is also shown, in red, along with its 95% confidence interval. The plotted values are relative to the most recent Mean Sea Level datum established by NOAA CO-OPS.
Options
| Graph from: | ||
| Calculate using: | ||
| Show MSL from: |
|
| ||||
| To: | ||||
Height: pixels
(default 450).
Width: pixels
(default is determined by window width).
Or, to change graph width, resize browser window and click:
Data source: ? months from NOAA + ? months from PSMSL.
Click
 here for a downloadable, bookmarkable image
(except in Internet Explorer or Microsoft Edge, use
PrtScn,
or see NOAA's version, or
PSMSL's version.)
For
 a simple explanation
of the meaning of the 95% confidence & prediction interval traces shown in the graph, see
this two-minute instructional video,
by Dr. Gerard Verschuuren.
Regressions
Linear:
Quadratic:
where:
To see precise values, hover your mouse cursor over the graph traces (or touch the graph on a touch-screen).
To download the seasonally-adjusted monthly MSL data from NOAA in CSV format click here, or for unadjusted ("raw") data click here.
We also have a graph of just carbon dioxide (CO2) levels, and a combined graph of CO2 and CH4.
†Calculation of Confidence Intervals and Prediction Intervals for monthly Mean Sea-Level (MSL) is complicated by the fact that MSL measurement data is serially autocorrelated. That means each month's MSL measurement is correlated, to an extent which varies by location, with the MSL measurements of the previous and next months. That means there are effectively fewer independent measurements, which would cause a naive confidence interval calculation to underestimate the breadth of the intervals. The code here follows the method of Zervas 2009, “Sea Level Variations of the United States 1854-2006,” NOAA Technical Report NOS CO-OPS 053, p. 15-24, to account for autocorrelation, when calculating confidence intervals and prediction intervals. That isn't the only way to do it, though, and one of the items on my to-do list is to examine an alternative approach suggested by Willis Eschenbach.
© 2019 www.sealevel.info