Quadratic
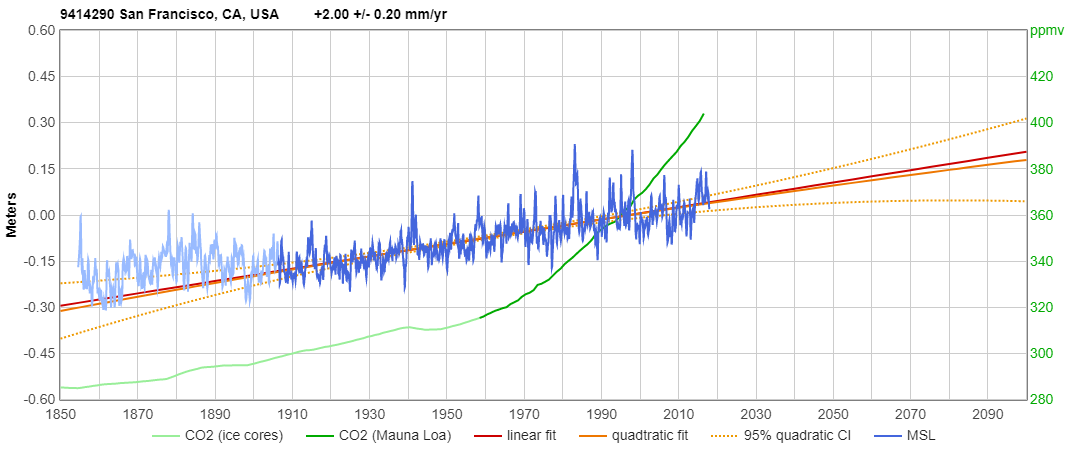
regression is calculated starting the month after the 1906 earthquake,
to avoid questionable data (it ends with January, 2018), and I've
plotted confidence intervals for the quadratic trend:
(click graph for enlarged, interactive version)
The
red line is the linear trend; the solid orange line is the quadratic
trend, and the dotted orange lines are the 95% confidence interval for
the quadratic trend.
As you can see, there is no acceleration. It is actually −0.00296 ±0.01385 mm/yr². (The minus sign means deceleration, but it isn't statistically significant.)
There has been no acceleration at all in the rate of sea-level rise at San Francisco since the 1906 earthquake.
That's
typical for coastal sea-level measurements. Most show no significant
acceleration since the 1920s or even earlier. Here are a couple of
other sites with particularly high quality measurement records:
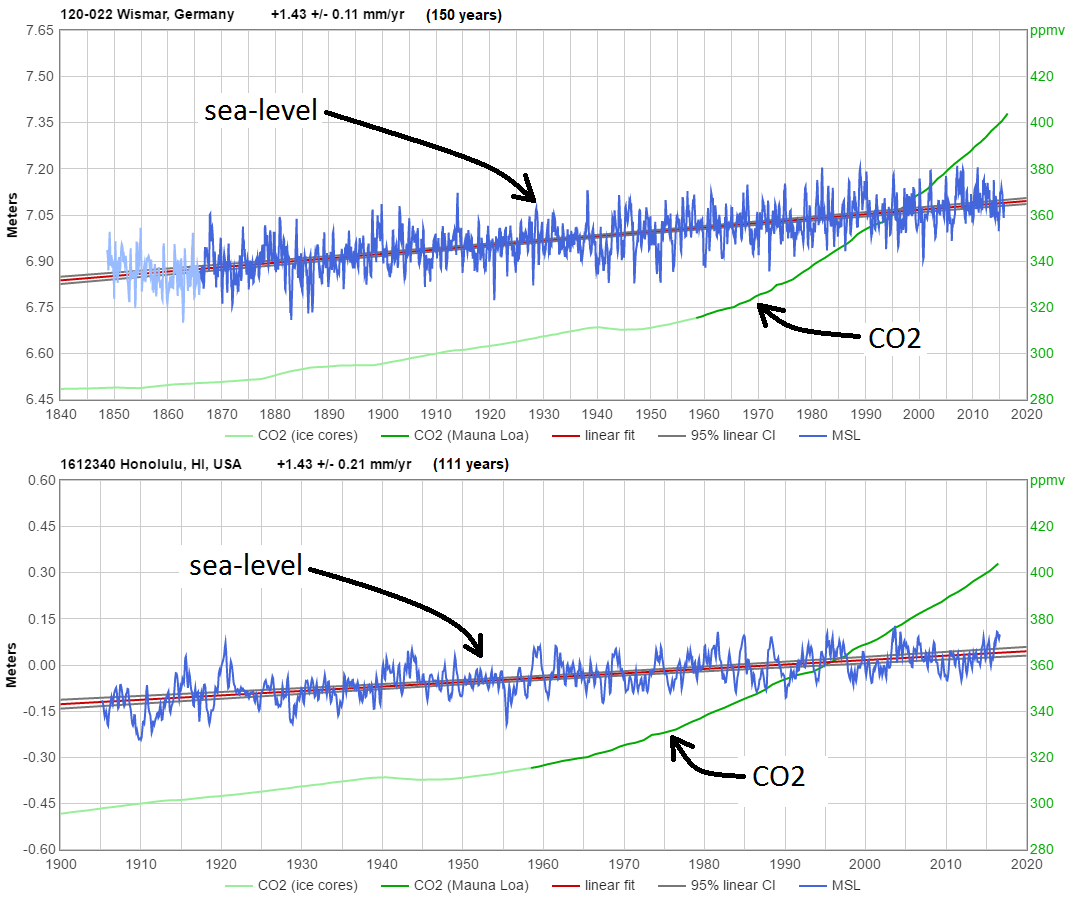
As you can see, sea-level is rising no faster now, with CO2 above 400 ppmv, than it was nine decades ago, with CO2 level 100 ppmv lower.
Since precise measurements of CO2 began in 1958, CO2 levels have risen every year year for fifty-nine consecutive years, from 315 ppmv in 1958 to 407 ppmv now, totaling a 29% increase, with no detectable effect on the rate of sea-level rise.
This is iron-clad, indisputable proof that CO2 emissions do not significantly affect sea-level.
That
fact is surprising to many people, because they think that warming
"simply must" cause accelerated sea-level rise. That confusion is
usually because they're only aware of three climate-related factors
which affect sea-level: melting, glacier calving, and thermal expansion.
In fact, there are there are at least eight factors which significantly affect global sea-level. They are:
- snowfall
- sublimation of grounded ice
- melting of grounded ice
- glacier calving
- thermosteric changes (thermal expansion)
- vertical land movement, including post-glacial sinking of the ocean floor
- groundwater extraction
- water sequestration behind dams and in natural lakes
#5 on that list (thermosteric change / thermal expansion) is a special case, because thermal expansion of water in the upper layer of the open ocean causes strictly-local sea-level
rise, only. Because gravity balances mass, not volume, such "sea-level
rise" causes no net lateral flows of water, and doesn't affect
sea-level elsewhere. Thermal expansion in the upper layer of the open
ocean causes sea-level rise which affects satellite altimetry, but does
not affect coastal sea-level.
#7 and #8 are both anthropogenic (i.e., caused by mankind), and both should be expected to cause a slight acceleration in sea-level rise (in the case of water sequestration it's because most of the big dams were built and filled in the mid-20th century, and the rate of water sequestration has declined), but they are not climate-related.
#1
through #4 are the four factors which affect ice sheet mass balance in
Greenland and Antarctica: snowfall, sublimation, melting, and glacier
calving. The most important of those factors is snowfall. If you didn't know that, because the sources you read only mention factors which cause ice mass loss, then you've been reading propaganda, rather than unbiased science.
In both Greenland and Antarctica, snowfall is by far the most important of those four factors. In fact, in Antarctica, snowfall accumulation is approximately equal to the sum of the other three factors.
The magnitude and importance of snowfall on ice sheet mass balance (and thus sea-level) is illustrated by the story of Glacier Girl.
She's a Lockheed P-38 Lightning which was extracted in pieces from beneath 268 feet of accumulated ice and snow (mostly ice), fifty years after she landed on the Greenland Ice Sheet.
Do the arithmetic and you'll calculate an astonishing number: more than 5 feet of ice per year, which is equivalent to more than seventy feet of annual snowfall!
That ice and snow represents evaporated water, mostly removed from the Arctic and North Atlantic Oceans, which then fell as ocean-effect snow on the Greenland Ice Sheet.

The story of Glacier Girl is fascinating. You can read more about it here:
and here:
So, the key question is: what happens to snowfall in a warming climate?
The answer is that it increases, for two reasons.
First, it increases simply because warmer air holds more moisture. Every meteorologist knows that the biggest snowfalls occur when the temperature is not too far below freezing.
Second, a warmer climate should reduce sea-ice extent, increasing evaporation from the Arctic, North Atlantic, and Southern Oceans, and thereby increasing Lake/Ocean-Effect Snowfall (LOES) downwind. (Ice-covered water does not produce LOES.)
When additional snow falls on ice sheets and glaciers, in adds to ice mass accumulation and subtracts from sea-level.
Warmer temperatures do not necessarily
melt ice sheets and raise sea-level. Where ice sheets or glaciers are
near 0°C, or the ice is grounded below the ocean's waterline, warmer
temperatures can, indeed, accelerate melting. But most of Antarctica
averages more than 40° below zero, so it is in no danger of melting
from a few degrees of warming. Only in southern Greenland, on the
Antarctic Peninsula, and where ice sheets are grounded below sea-level
and in contact with the ocean, is significant melting even plausible.
So we know that in a warming climate there are some factors which increase sea-level, and other factors which reduce sea-level. There's no fundamental reason to suppose that either of those will dominate the other.
We
can, however, draw upon the historical record, to gain insight. At the
best tectonically stable locations, sea-level has been rising at about
1½ mm/year (6 inches per century) since the 1920s or before, with no sign of significant acceleration due
to rising CO2 levels. At San Francisco, sea-level rise is just slightly
more rapid, at 2.0 mm/year (8 inches per century), but, again, with no
sign of acceleration.
So
the best estimate of sea-level rise at San Francisco by 2100 is simply
a linear extrapolation of the current linear sea-level trend: 2.00 mm/yr × 82 years / 25.4 mm/inch = 6.5 inches.
For planning purposes, it might be wise to use the upper end of the 95% confidence interval.
Using the linear trend, that would be (2.00 + 0.20) mm/yr × 82 years / 25.4 mm/inch = 7.1 inches.
Using the quadratic regression confidence intervals, it's 0.276 meters = 10.9 inches.
Using the quadratic regression confidence intervals, it's 0.276 meters = 10.9 inches.
None of those numbers are frightening, and none of them can be blamed on the oil companies.