https://robertscribbler.com/2017/08/18/the-present-threat-to-coastal-cities-from-antarctic-and-greenland-melt/#comment-121687
Screenshot: http://sealevel.info/robertscribbler.com_comment-121687.png
daveburton August 20, 2017
Your comment is awaiting moderation.
(as of 2/20/2019 it's been "awaiting moderation" for 18 months)
That 20th century rate of 1.4 mm/year is about right. But the problem with that graph is that it conflates measurements made in different places and by radically different means, to create the illusion of a sharp acceleration in 1993. If you don't make that mistake the acceleration since the 1920s disappears.
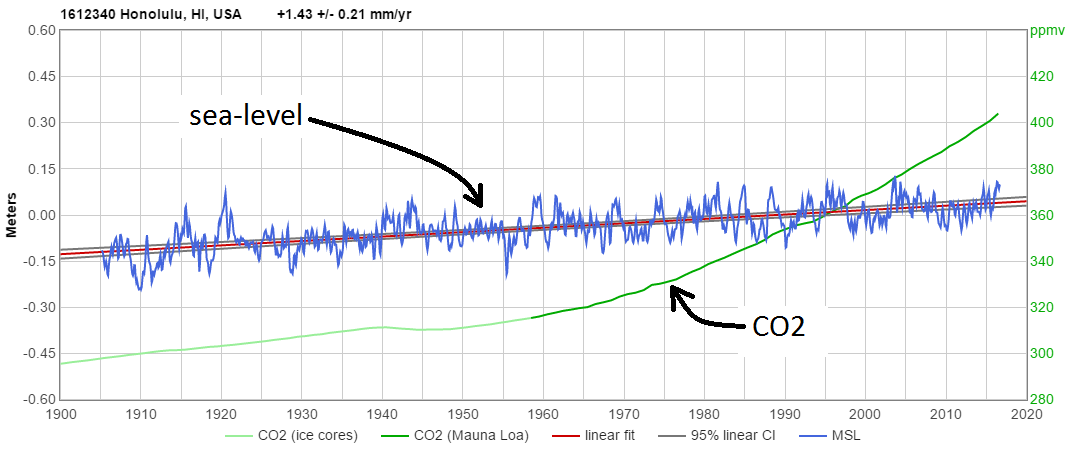
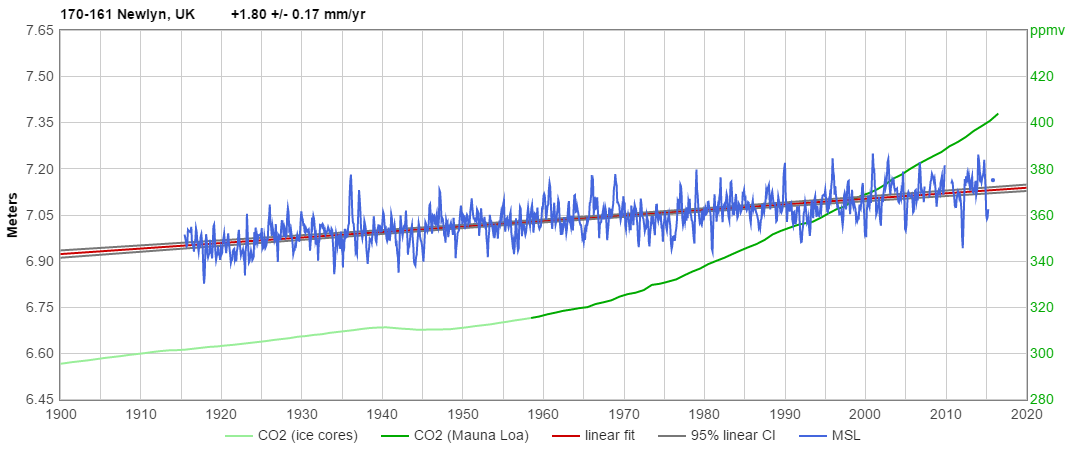
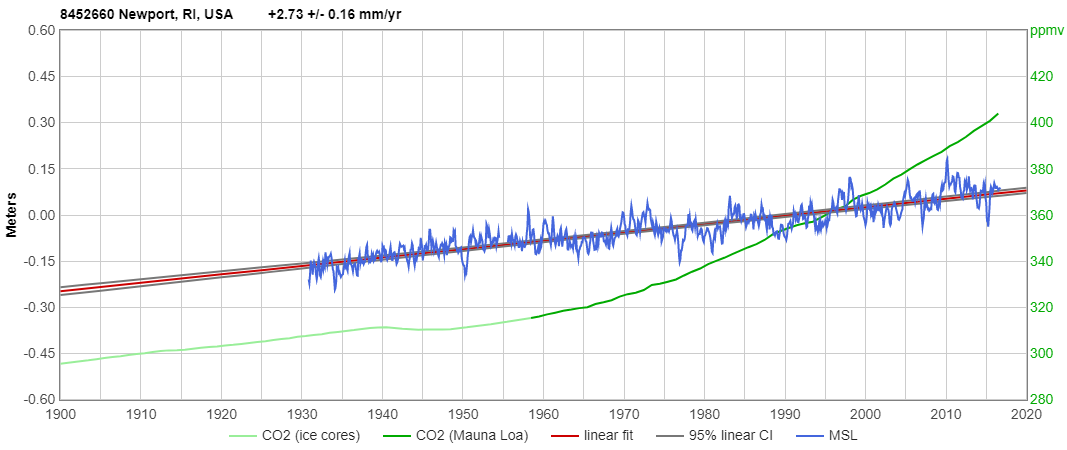
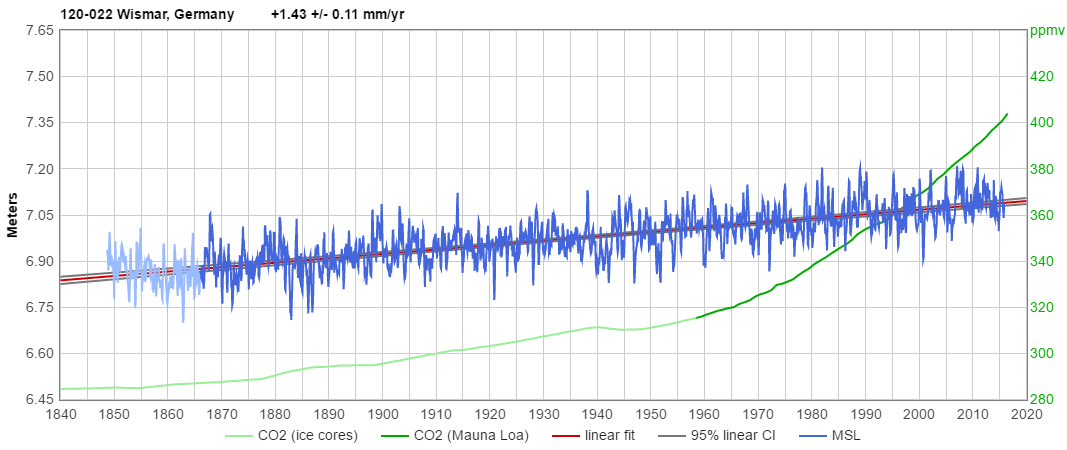
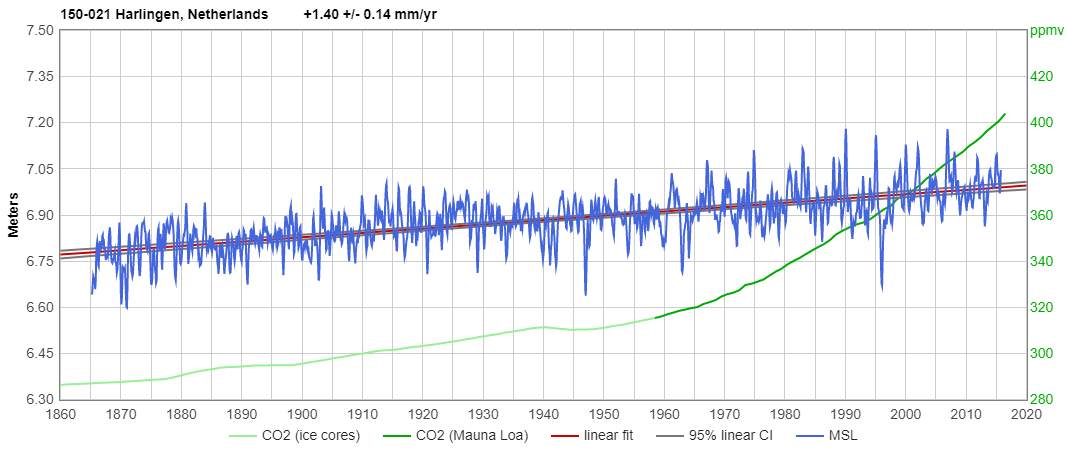
Here is measured sea level (in blue) vs. CO2 level (in green), from around the world:
Mid North Pacific / Hawaii:
http://sealevel.info/MSL_graph.php?stnid=honolulu&thick&boxcar=1
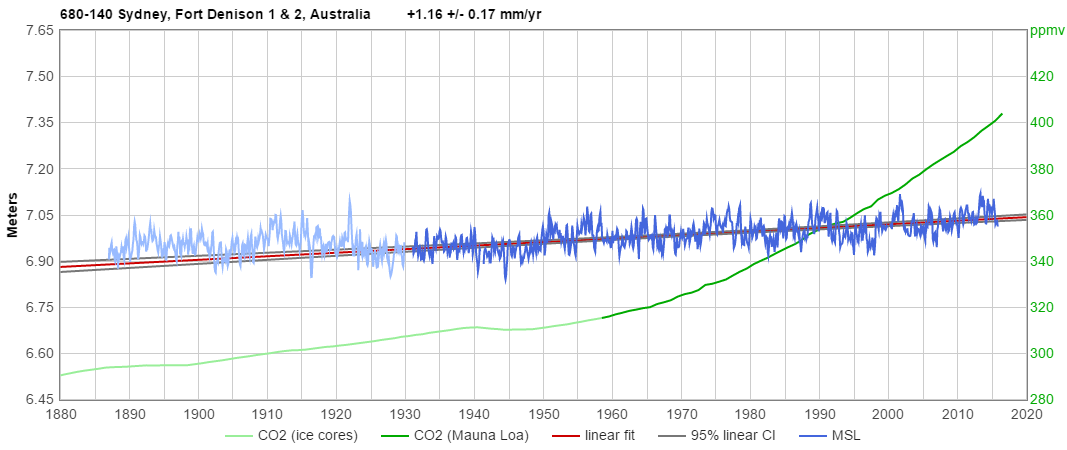
South Pacific / Australia:
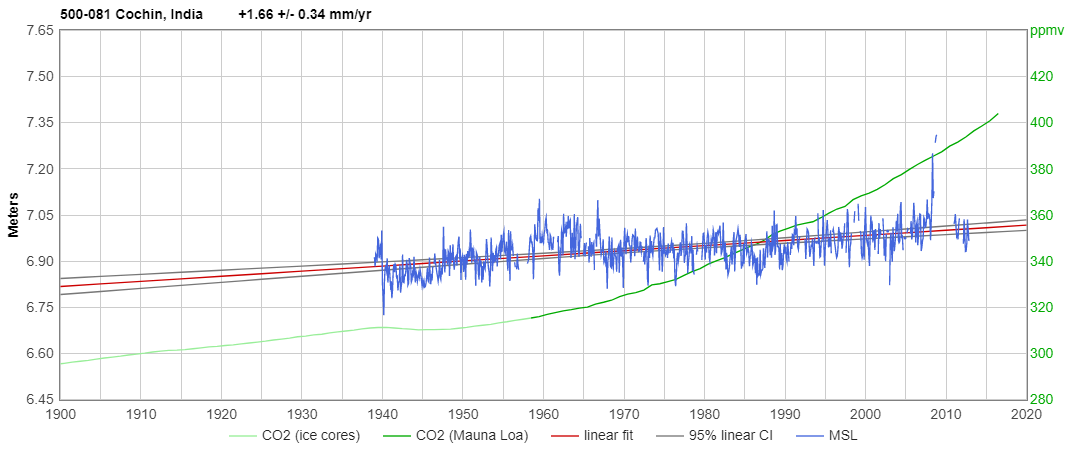
Indian Ocean / India:
http://www.sealevel.info/MSL_graph.php?id=Cochin
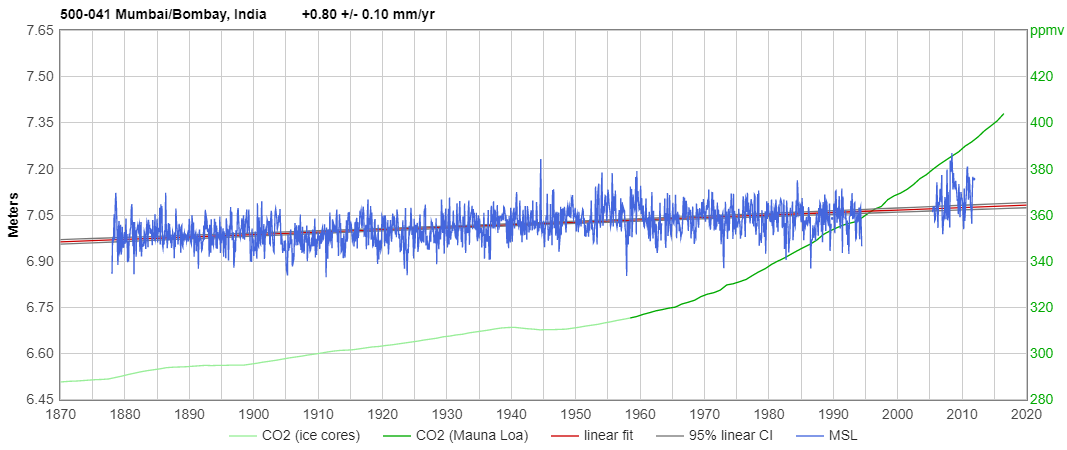
Arabian Sea / India:
http://www.sealevel.info/MSL_graph.php?id=Mumbai
Atlantic / UK:
http://sealevel.info/MSL_graph.php?stnid=newlyn&thick&boxcar=1
Atlantic / US East Coast:
http://www.sealevel.info/MSL_graph.php?id=Newport,+RI&boxcar=1&boxwidth=3
Baltic Sea / Germany:
North Sea / Netherlands:
http://www.sealevel.info/MSL_graph.php?id=Harlingen&boxcar=1&boxwidth=3
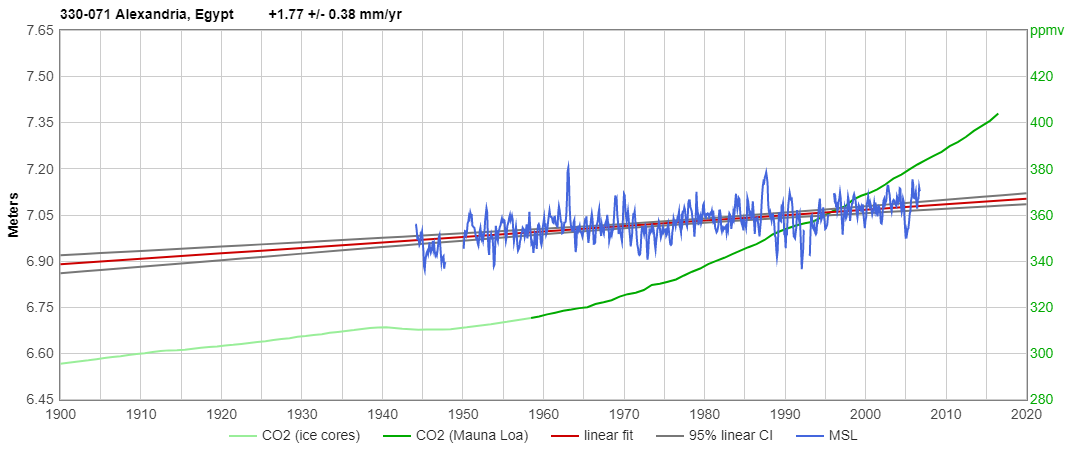
Mediterranean / Egypt:
http://www.sealevel.info/MSL_graph.php?id=Alexandria&boxcar=1&boxwidth=3
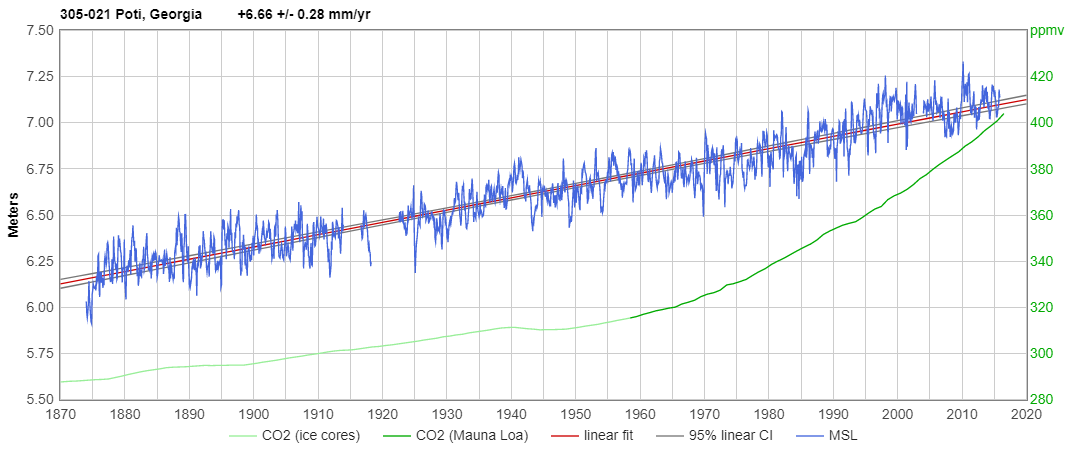
Black Sea / Georgia (note the different scale for this one):
http://www.sealevel.info/MSL_graph.php?id=Poti
Adriatic Sea / Italy:
http://www.sealevel.info/MSL_graph.php?id=Trieste&boxcar=1&boxwidth=3
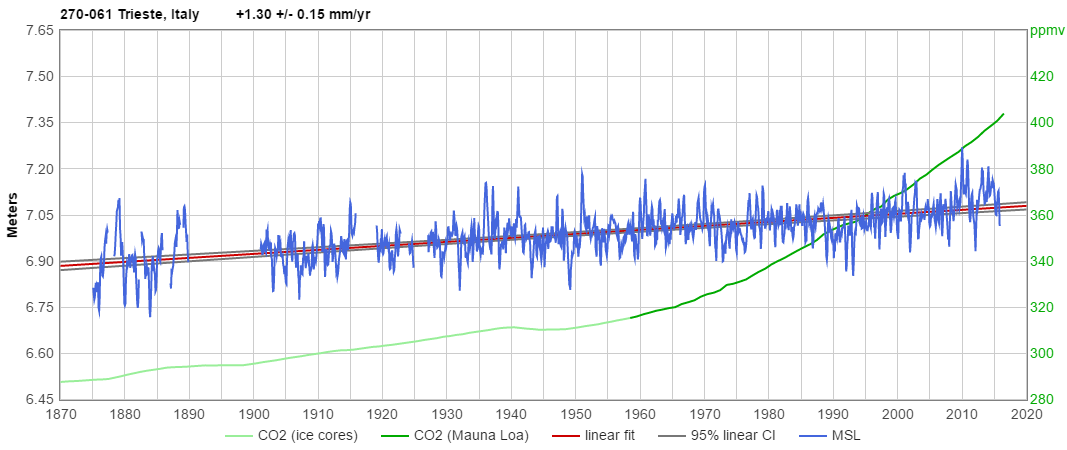
So, what do the graphs tell you?
1. CO2 level has increased about 30% in the last 3/4 century, and 37% since 1900. And,
2. Sea-level rise has been almost perfectly linear since the 1920s (and in many places for even more than a century). And,
3. CO2 level has had no noticeable effect on sea level, thus far.
Therefore:
4. Since the rate of sea-level rise has not increased significantly in response to the last 3/4 century of heavy CO2 emissions, there is no reason to expect that it will do so in response to the next 3/4 century of CO2 emissions. The best prediction for sea level in the future is simply a linear projection of the history of sea-level at the same location in the past.
That conclusion is reinforced by the fact that increases in CO2 level have a logarithmically diminishing impact on temperature, and hence on any secondary factor thought to be influenced by temperature, like sea-level.