_ERB_all_sky_75pct.png)

Click a column header to view that diagram:
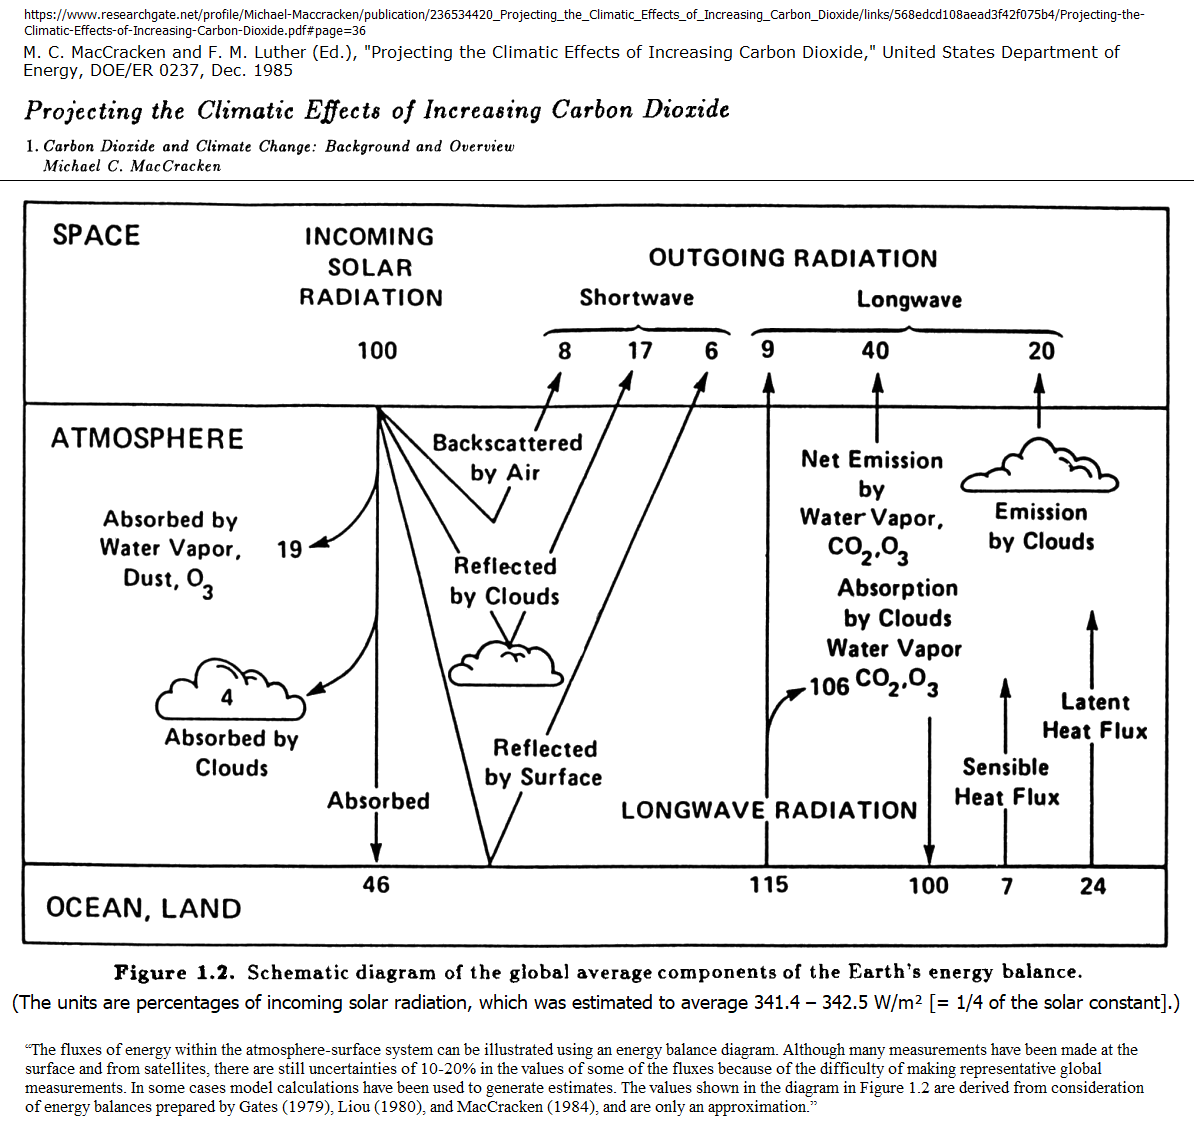
| MacCracken 1985 and Lindzen 1990 |
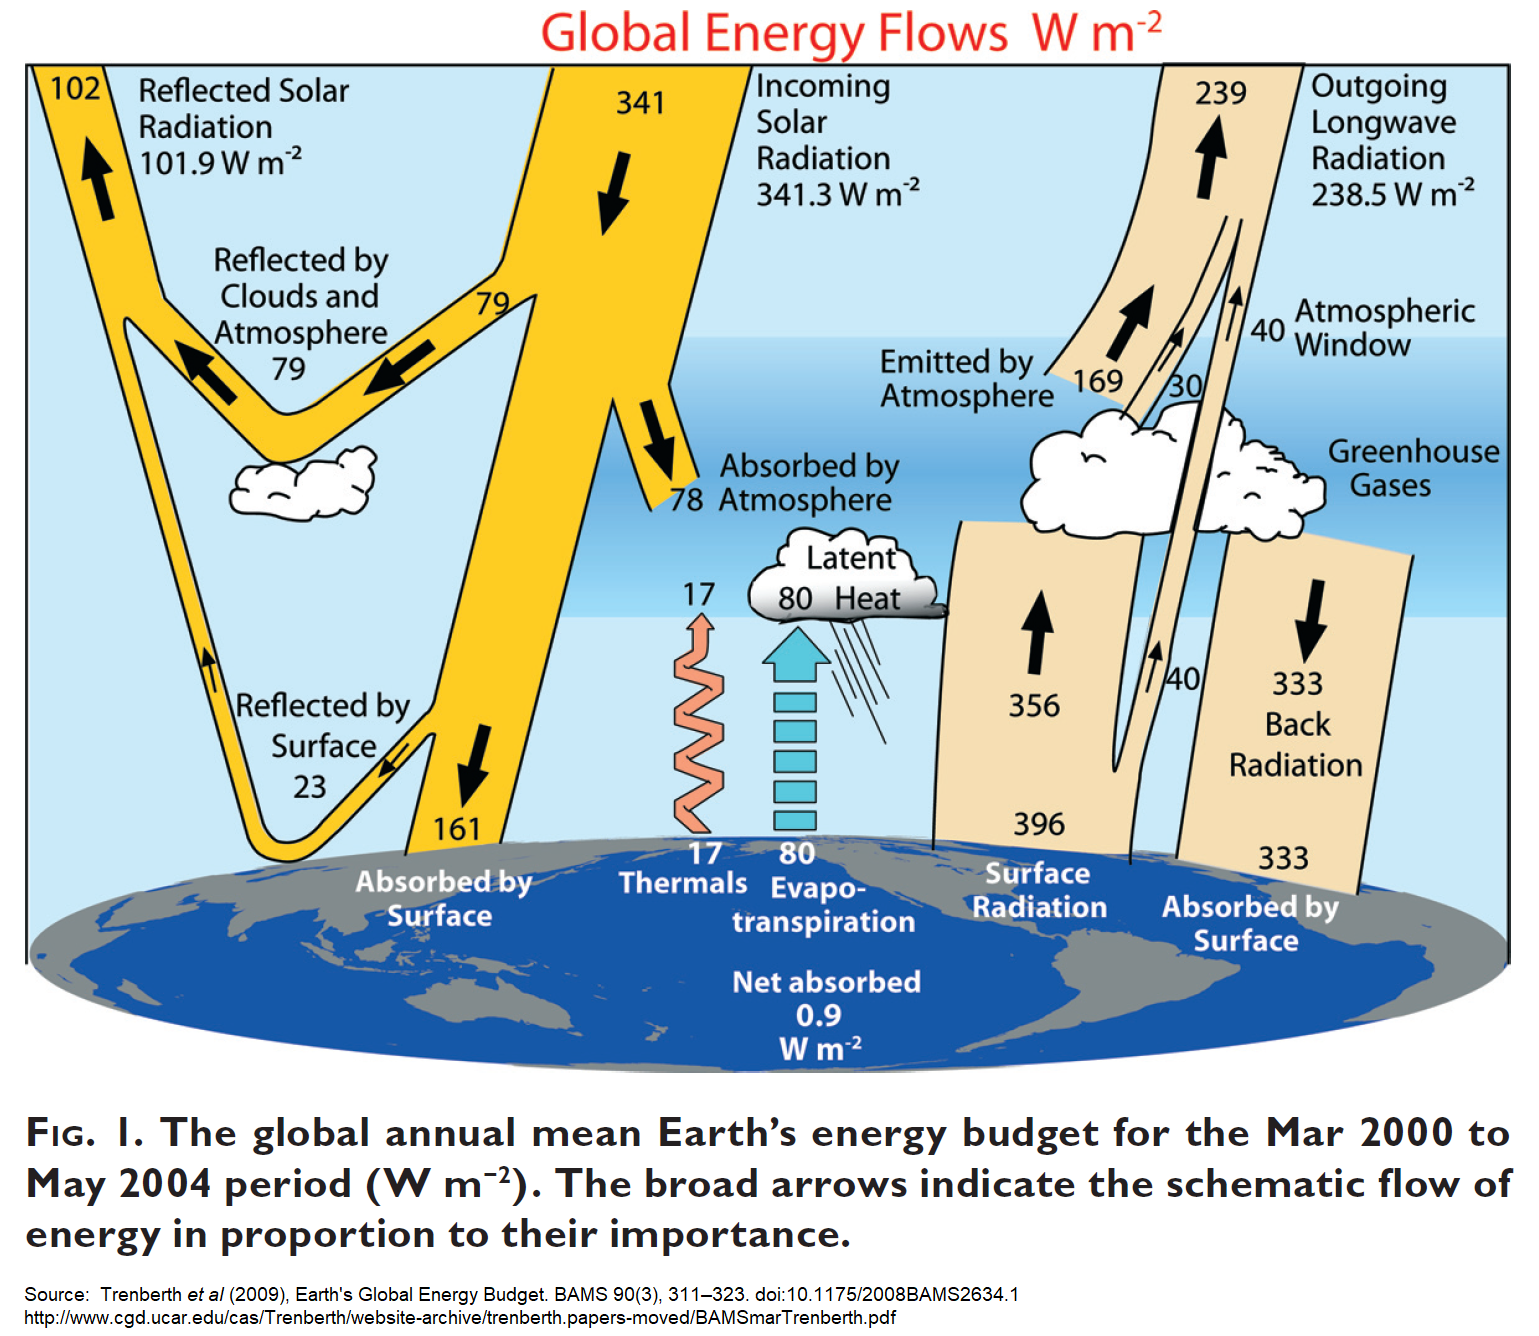
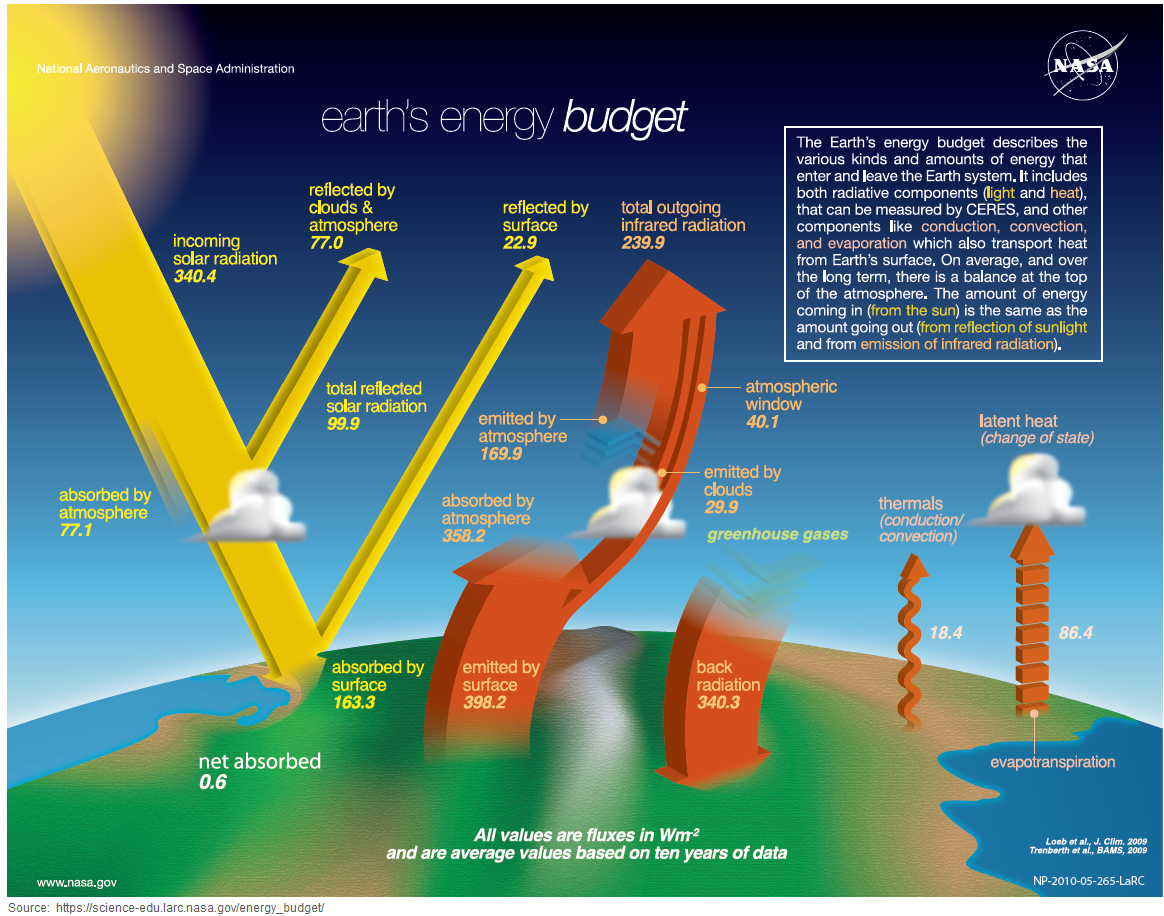
Trenberth 2009 | NASA 2014 | NCA4 2017 and AR5 2013 |
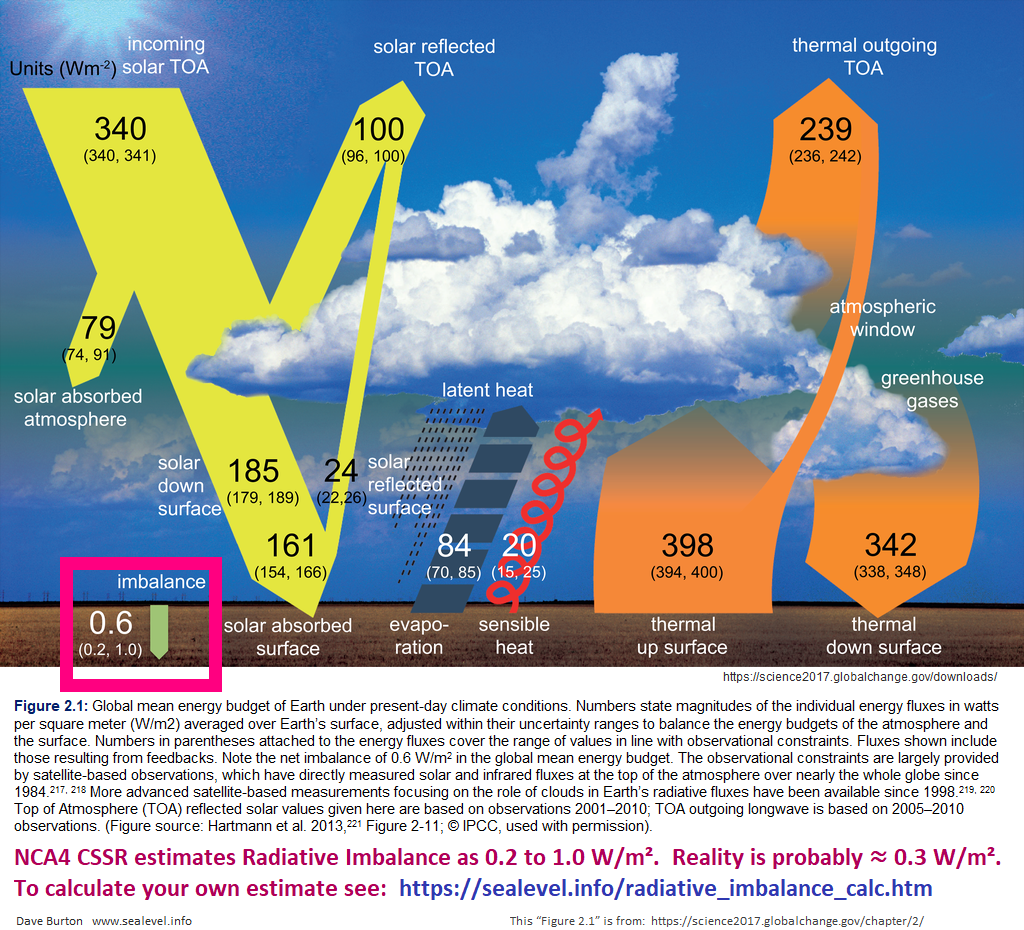
AR6 2021 | Description |
|---|---|---|---|---|---|
| 100% | 341.3 W/m² = 100.0% | 340.4 W/m² = 100.0% | 340 W/m² = 100.0% | 340 W/m² = 100.0% | TOA incoming solar (the "solar constant" divided by four) |
| 46% | 161 W/m² = 47.2% | 163.3 W/m² = 48.0% | 161 W/m² = 47.3% | 160 W/m² = 47.0% | surface heating from absorbed solar radiation |
| 24% | 80 W/m² = 23.4% | 86.4 W/m² = 25.4% | 84 W/m² = 24.7% | 82 W/m² = 24.1% | surface cooling by evaporation (net latent heat transport) |
| 115% | 396 W/m² = 116.0% | 398.3 W/m² = 117.0% | 398 W/m² = 116.9% | 398 W/m² = 116.9% | LW IR emissions from the surface ("thermal up surface") |
| 100% | 333 W/m² = 97.6% | 340.3 W/m² = 100.0% | 342 W/m² = 100.5% | 342 W/m² = 100.5% | absorbed downwelling LW IR ("back radiation" or "thermal down surface") |
| 15% | 63 W/m² = 18.5% | 57.9 W/m² = 17.0% | 56 W/m² = 16.5% | 56 W/m² = 16.5% | surface cooling from net LW IR fluxes (NASA 2014 is 398.2−340.3) |
| 7% | 17 W/m² = 5.0% | 18.4 W/m² = 5.4% | 20 W/m² = 5.9% | 21 W/m² = 6.2% | surface cooling from convection & conduction ("sensible heat") |
| MacCracken 1985 has held up well, but note that the figures it shows are percentages of TOA (top of atmosphere) average incoming radiative energy (from sunlight). The other (more recent) diagrams instead show W/m². | Trenberth's diagram hos mostly held up well, except that its radiative imbalance figure ("net absorbed") is about 3× a realistic estimate. | NASA's diagram has up-to-date figures, but it also has two major defects: 1. it shows the fluxes with absurd precision and no confidence intervals at all, and 2. the radiative imbalance that it shows is about 2× a realistic estimate. |
NCA4 / AR5 has reasonable confidence intervals, but: 1. it uses odd terminology, such as "sensible heat" for thermals (conduction/ 2. its imbalance figure is about 2× a realistic estimate, and 3. it does not quantify energy loss through the atmospheric window. |
This is AR6 WG1 Fig. 7.2. Its worst faults are: 1. its imbalance figure is about 2.3× a realistic estimate, with a much too tight CI, 2. it uses the same obscure terminology as AR5 (e.g., "sensible heat" for conduction/ 3. it does not quantify energy loss through the atmospheric window. |
For other fluxes, see the diagrams (click on the header links in the table). |
Notes:
● For NCA4 / AR5 and AR6, you can hover your mouse cursor over the figures in the table to see the confidence intervals (and, in some cases, notes).
● To calculate your own estimates of radiative imbalance and equilibrium climate sensitivity, see the online "radiative imbalance calculator" spreadsheet.
Twitter card (click to enlarge):
Last modified: 06-Jun-2026 (version 8)