Censored comments on SkepticalScience's “Examining Hansen's prediction about the West Side Highway” article
2 August, 2023
Background: in 1988 Dr. James Hansen predicted to Salon reporter Bob Reiss that, due to manmade climate change, in 40 years (by 2028) New York City's West Side Highway will be under water. (Salon misreported it as 20 years.)
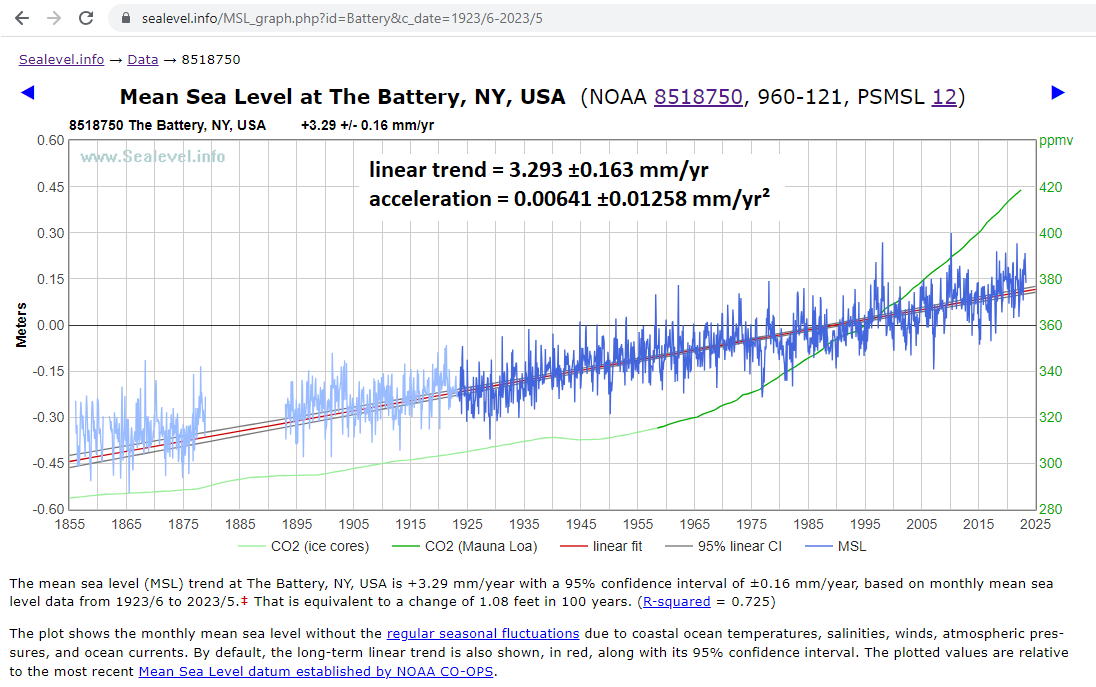
That's obviously wrong. With only five years to go before 2028, mean sea-level at The Battery in Manhattan has risen by only about 6.7 inches (some of which is due to subsidence). The rate of sea-level rise there has not detectably accelerated over the last century, and the West Side Highway (the southern extension of the Henry Hudson Parkway) is still about ten feet above mean sea-level.
Coincidentally, the West Side Highway is just 1/3 mile from NOAA's longest operational Atlantic sea-level measurement site: The Battery tide gauge, at the southern tip of Manhatten Island. So we don't have to wonder how sea-level has actually changed at the West Side Highway:
Several climate blogs have discussions of this topic. The best is probably this
excellent article by Anthonly Watts at “Watts Up With That” (WUWT):
John Cook's (misleadingly named) “Skeptical Science” (SkS) blog also
has an article about it:
Unfortunately, SkS whitewashed Hansen's failure. As with much of their other material, the purpose of the SkSk article is to propagandize for climate alarmism. When the truth gets in the way of that purpose, the truth generally loses.
This web page is about my attempts to comment on that SkS article. The good news is that they allowed six of my comments [1] [2] [3] [4] [5] [6].
That might be a new record! In fact, I began to hope that they'd ended their longstanding practice of censoring dissent.
But no such luck: they deleted the rest of my comments [7] [8] [9].
However, you can read them here:
[7] https://skepticalscience.com/argument.php?p=2&t=38&&a=457#141332
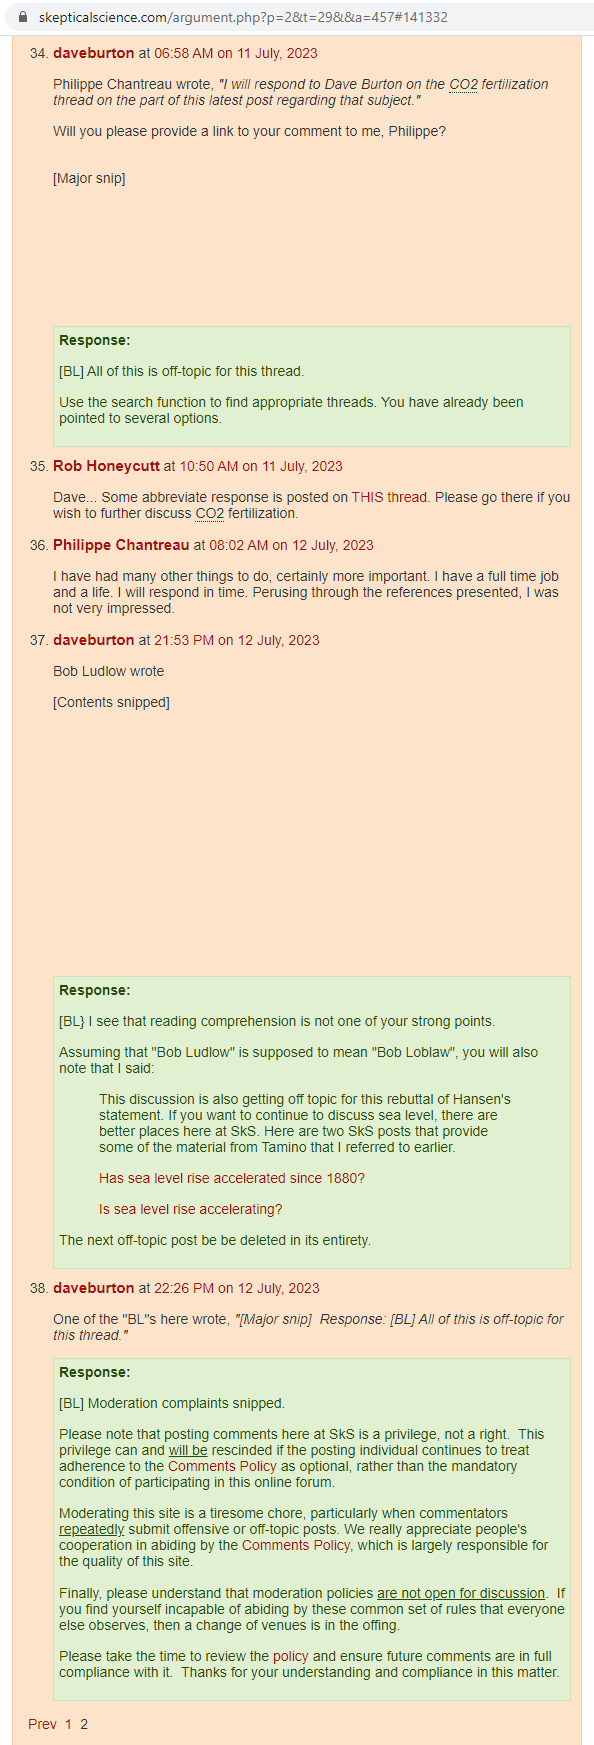
This is what I wrote, which they censored:
Philippe Chantreau wrote, "I will respond to Dave Burton on the CO2 fertilization thread on the part of this latest post regarding that subject."
Will you please provide a link to your comment to me, Philippe?
Rob Honeycutt wrote, "1) That is not an image that appears in AR6, not with the added orange box. Thus you're co-opting their work to infer conclusions they do not make."
That's incorrect.
Since we're onto the next page of comments now, here's the image again:
https://sealevel.info/AR6_FAQ_5p1_Fig_1b_final2.png
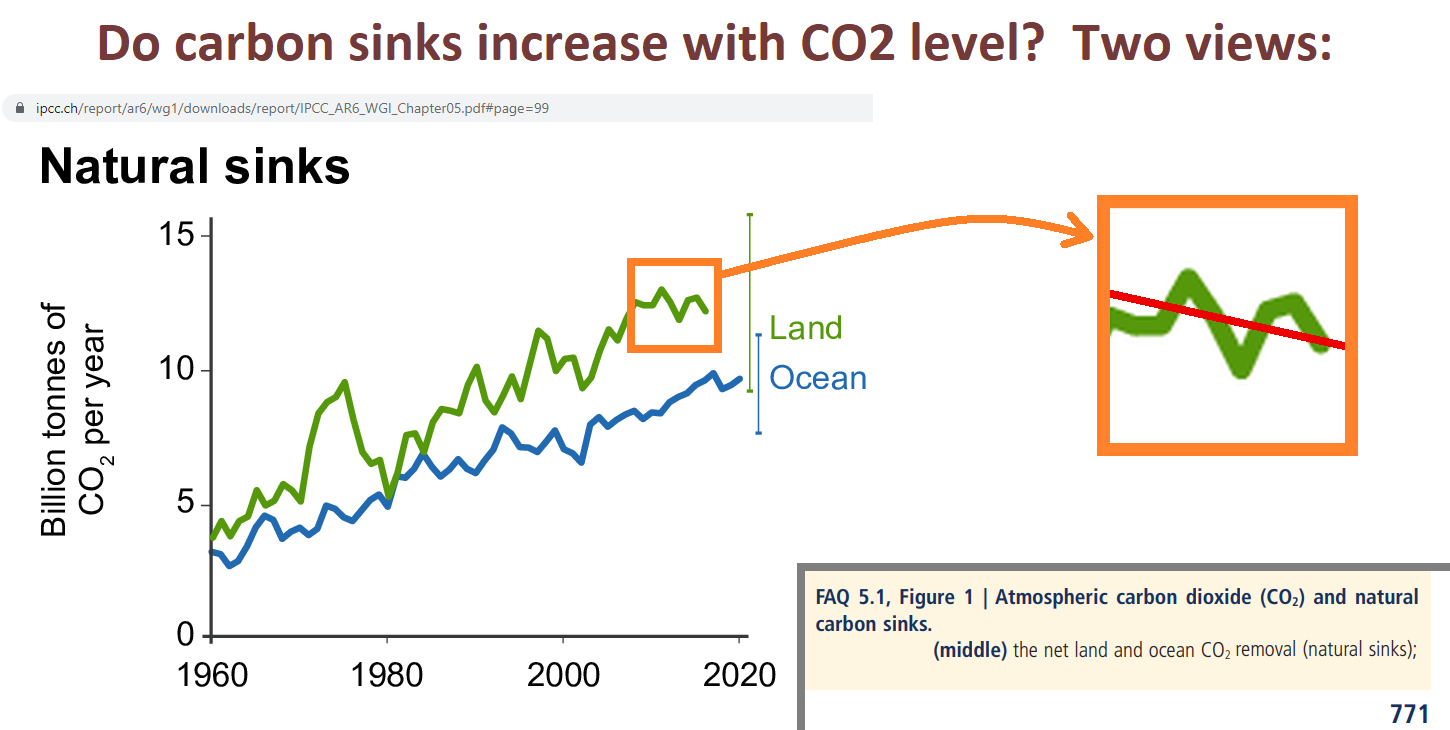
If you enlarge it you can see, in fine print, the URL that will take you to where you can find it in chapter 5 of AR6:
I added the orange box to highlight the (small) part of the image which supports your contention that, "greening is now turning into 'browning.' ... fertilization [has now been] overwhelmed by other effects... In other words, the greening has now stopped."
AR6 directly contradicts your contention, Rob. In fact, it does so in the caption on that very figure:

They could not have been clearer in stating that natural removal of carbon from the atmosphere is NOT weakening.
The authors did PREDICT a "decline" in the FUTURE, "if" emissions "continue to increase." But that hasn't happened yet, and the "decline" which they predicted was NOT for the rate of natural CO2 removals by greening and marine sinks, anyhow. Rather, that hypothetical decline was predicted for the ratio of natural removals to emissions, and their prediction is conditional, depending on what happens with future emissions ("if CO2 emissions continue to increase").
Well, predictions are cheap. My prediction is that natural removals of CO2 from the atmosphere will continue to accelerate, for as long as CO2 levels rise.
The "fraction" which they predict might decline, someday, doesn't represent anything physical, anyhow. (It is one minus the equally unphysical "airborne fraction.") Our emission rate is currently about twice the natural removal rate, so if emissions were halved, the removal "fraction" would be 100%, and the atmospheric CO2 level would plateau. If emissions were cut by more than half then the removal "fraction" would be more than 100%, and the CO2 level would be falling.
Rob, it's possible that your confusion on the greening/browning point was due to a widely publicized paper, with an unfortunately misleading title:
Wang et al (2020), "Recent global decline of CO2 fertilization effects on vegetation photosynthesis." Science, 11 Dec 2020, Vol 370, Issue 6522, pp. 1295-1300, doi:10.1126/science.abb7772
Many people were misled by it. You can be forgiven for thinking, based on that title, that greening due to CO2 fertilization had peaked, and is now declining.
But that's not what it meant. What it actually meant was that the rate at which plants remove CO2 from the atmosphere has continued to accelerate, but that its recent acceleration was less than expected. (You can't glean that fact from the abstract; would you like me to email you a copy of the paper?)
What's more, if you read the "Comment on" papers responding to Wang, you'll learn that even that conclusion was very dubious:
Sang et al (2021), "Comment on 'Recent global decline of CO2 fertilization effects on vegetation photosynthesis'." Science 373, eabg4420. doi:10.1126/science.abg4420
Frankenberg et al (2021), "Comment on 'Recent global decline of CO2 fertilization effects on vegetation photosynthesis'." Science 373, eabg2947. doi:10.1126/science.abg2947
Agronomists have studied every important crop, and they all benefit from elevated CO2, and experiments show that the benefits continue to increase as CO2 levels rise to far above what we could ever hope to reach outdoors. Perhaps surprisingly, even the most important C4 crops, corn (maize) and sugarcane, benefit dramatically from additional CO2. C3 plants (including most crops, and all carbon-sequestering trees) benefit even more.
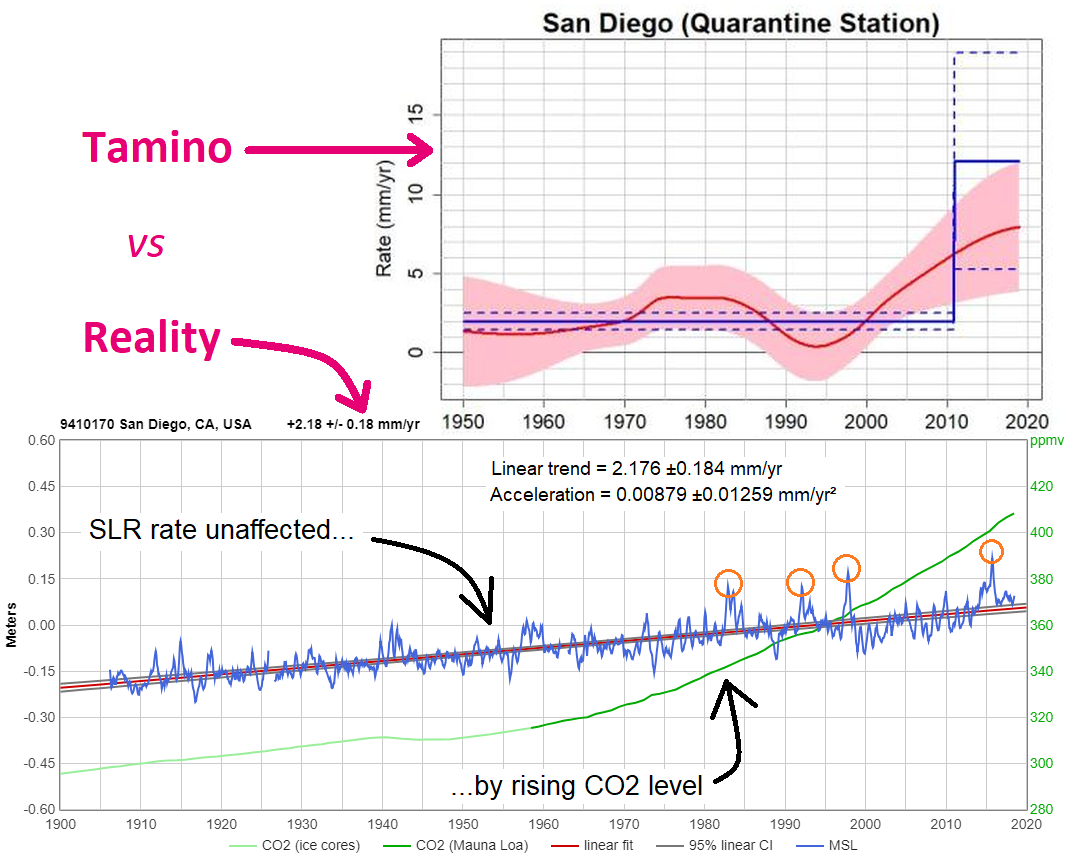
Bob Loblaw wrote, "...I have no way of knowing whether our daveburton is the same Dave Burton seen in the discussions at Tamino's... The other Dave Burton's name shows up quite a few times, although he does not comment."
Yes, I'm the Dave Burton who Tamino intermittently criticizes. Unfortunately, when I try to comment on his blog, he nearly always deletes my comments, so I stopped trying. Suffice to say, if you like being misled, you should enjoy his blog. (Example.)
[8] https://skepticalscience.com/argument.php?p=2&t=38&&a=457#141339

This is what I wrote, which they censored:
Bob Ludlow wrote, "You have no objective criteria to declare that The Battery and Honolulu are "the best" at representing anything other than local effects..."
The Battery has 1825 months of sea-level measurements. No other NOAA Atlantic site has that much. Only San Francisco has more, but it has only 1404 months of measurements since the 1906 earthquake. The downside to The Battery's measurement record is its high (atypical) rate of subsidence, which roughly doubles the local ("relative") sea-level trend there.
There are some European sites with longer, better Atlantic / North Sea / Baltic measurement records, and Australia has an excellent Pacific measurement record, but there are substantial delays getting data for those locations. My sealevel.info stie pulls data from NOAA frequently, so it's much more up-to-date.
Some of the European sites, have recorded a slight acceleration; it was most noticeable at Brest, which saw a 0.0 mm/year trend in the19th century, but a 1.6 mm/year trend since then, though there are substantial gaps in ther record.
Several German sites have particularly excellent measurement records; here's one of them:
In the Pacific, Honolulu has 1421 months (>118 years) of continuous sea-level measurements, without even a single missing month. Just as importantly, Honolulu is a near-ideal measurement site, near the middle of the world's largest ocean, on an "old" island with near-zero vertical land motion, small tides, and (unlike most places!) almost no seasonal cycle. What's more, its mid-Pacific location is near the pivot point of the east-west Pacific "teeter-totter," so it is little affected by ENSO "slosh." That is, El Niño and La Niña don’t affect sea-level there much at all. It really is a superb dataset.
Bob continued, "Just because they have long records does not mean that they accurately reflect regional or global trends."
That's true. As I've mentioned, NYC's sea-level trend is atypical, because of the high rate of subsidence there.
However, if subsidence / uplift are due to very long term processes, like PGR, there's reason to hope that they are fairly consistent over the duration of the measurement record. In that case, even if the linear trend is greatly affected by uplift or subsidence, the acceleration won't be. (Of course, that doesn't work in places, like Manila, where changing local factors, like groundwater pumping, cause varying subsidence.)
So it should not surprise you that, even though The Battery and Honolulu have seen quite different linear trends over the last century, the measured acceleration in both places is very similar (negligible).
Bob wrote, "You are clearly picking locations to try to tell the story you want to tell."
That's a false accusation. You just find the data surprising, so you make baseless accusations, without evidence. That is not conducive to constructive dialogue, nor to learning.
If you think I chose unrepresentative sites, or sites with inferior quality measurement data, then YOU tell me what sites YOU think are better, and why.
Bob wrote, "As for your quadratic fits: it has been pointed out to you over the past 10 years that quadratic fits mean nothing when the underlying data does not resemble a quadratic relationship."
Nobody competent makes that claim in the context of sea-level analysis.
If there were a step-change in some climate system input, then you could look for a step-acceleration as a consequence. But there's been nothing like that. The radiative forcing trend from CO2 has been very gradual, and strikingly linear (just barely more than linear) for the last forty years. It's been quite gradual for much longer than that.
Quadratic regression is the cannonical way of detecting gradual acceleration. It's how Church & White did it, and how every competent sea-level analyst since then has done it. When Hogarth reported that, "sea level acceleration from extended tide gauge data converges on 0.01 mm/yr²," that's what he was talking about.
[9] https://skepticalscience.com/argument.php?p=2&t=38&&a=457#141340
This is what I wrote, which they censored:
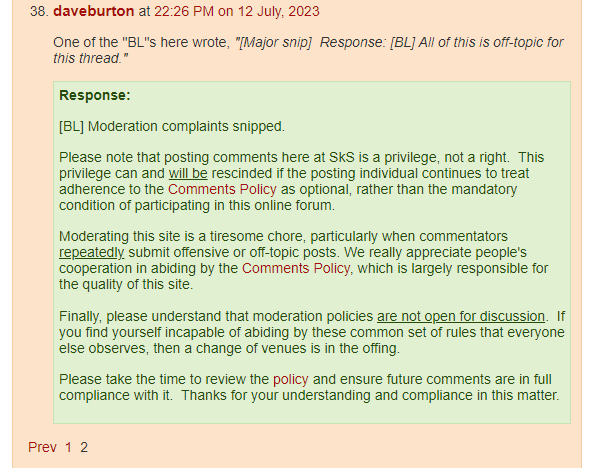
One of the "BL"s here wrote, "[Major snip] Response: [BL] All of this is off-topic for this thread."
And that is why SkS is not on my list of recommended climate change blogs.
You left Rob Honeycutt's accusations, but deleted my response to them.
You left Bob Loblaw's speculation about my identity, but deleted my response.
If this is not the right thread for the replies to those comments, then how can it be the right thread for them to make those comments, BL?
At that point I finally gave up.