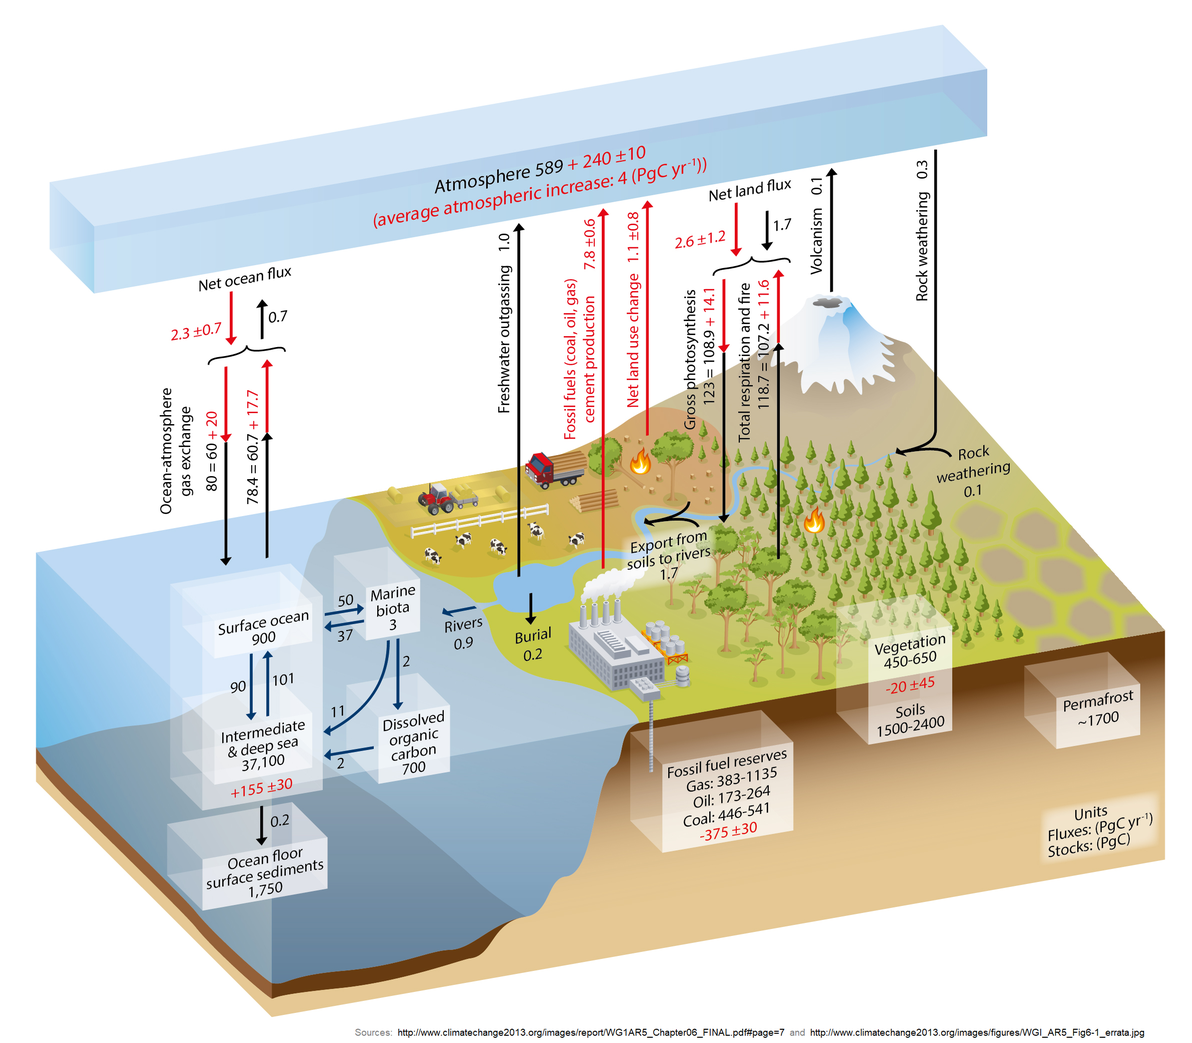
AR5 WGI Fig 6.1 (Simplified schematic of the global carbon cycle), with caption
This is from Chapter 6
of the IPCC's 2013 AR5 WG1 Report.
https://sealevel.info/carbon/

(click to enlarge)
Figure 6.1 | Simplified schematic of the global carbon cycle.
Numbers represent reservoir mass, also called ‘carbon stocks’ in PgC (1 PgC =
1015 gC) and annual carbon exchange fluxes (in PgC yr-1).
Black numbers and arrows indicate reservoir mass and exchange fluxes estimated
for the time prior to the Industrial Era, about 1750 (see Section 6.1.1.1 for
references). Fossil fuel reserves are from GEA (2006) and are consistent with
numbers used by IPCC WGIII for future scenarios. The sediment storage is a sum of
150 PgC of the organic carbon in the mixed layer (Emerson and Hedges, 1988) and
1600 PgC of the deep-sea CaCO3 sediments available to neutralize
fossil fuel CO2 (Archer et al., 1998). Red arrows and numbers
indicate annual ‘anthropogenic’ fluxes averaged over the 2000-2009 time period.
These fluxes are a perturbation of the carbon cycle during Industrial Era post
1750. These fluxes (red arrows) are: Fossil fuel and cement emissions of CO2
(Section 6.3.1), Net land use change (Section 6.3.2), and the Average
atmospheric increase of CO2 in the atmosphere, also called ‘CO2
growth rate’ (Section 6.3). The uptake of anthropogenic CO2 by the
ocean and by terrestrial ecosystems, often called ‘carbon sinks’ are the red
arrows part of Net land flux and Net ocean flux. Red numbers in
the reservoirs denote cumulative changes of anthropogenic carbon over the
Industrial Period 1750-2011 (column 2 in Table 6.1). By convention, a positive
cumulative change means that a reservoir has gained carbon since 1750. The
cumulative change of anthropogenic carbon in the terrestrial reservoir is the
sum of carbon cumulatively lost through land use change and carbon accumulated
since 1750 in other ecosystems (Table 6.1). Note that the mass balance of the
two ocean carbon stocks Surface ocean and Intermediate and deep ocean
includes a yearly accumulation of anthropogenic carbon (not shown).
Uncertainties are reported as 90% confidence intervals. Emission estimates and
land and ocean sinks (in red) are from Table 6.1 in Section 6.3. The change of
gross terrestrial fluxes (red arrows of Gross photosynthesis and Total
respiration and fires) has been estimated from CMIP5 model results (Section
6.4). The change in air-sea exchange fluxes (red arrows of ocean atmosphere gas
exchange) have been estimated from the difference in atmospheric partial
pressure of CO2 since 1750 (Sarmiento and Gruber, 2006). Individual
gross fluxes and their changes since the beginning of the Industrial Era have
typical uncertainties of more than 20%, while their differences (Net land
flux and Net ocean flux in the figure) are determined from
independent measurements with a much higher accuracy (see Section 6.3).
Therefore, to achieve an overall balance, the values of the more uncertain
gross fluxes have been adjusted so that their difference matches the Net
land flux and Net ocean flux estimates. Fluxes from volcanic
eruptions, rock weathering (silicates and carbonates weathering reactions
resulting into a small uptake of atmospheric CO2), export of carbon
from soils to rivers, burial of carbon in freshwater lakes and reservoirs and
transport of carbon by rivers to the ocean are all assumed to be pre-industrial
fluxes, that is, unchanged during 1750-2011. Some recent studies (Section 6.3)
indicate that this assumption is likely not verified, but global estimates of
the Industrial Era perturbation of all these fluxes was not available from
peer-reviewed literature. The atmospheric inventories have been calculated
using a conversion factor of 2.12 PgC per ppm (Prather et al., 2012).
471
Source:
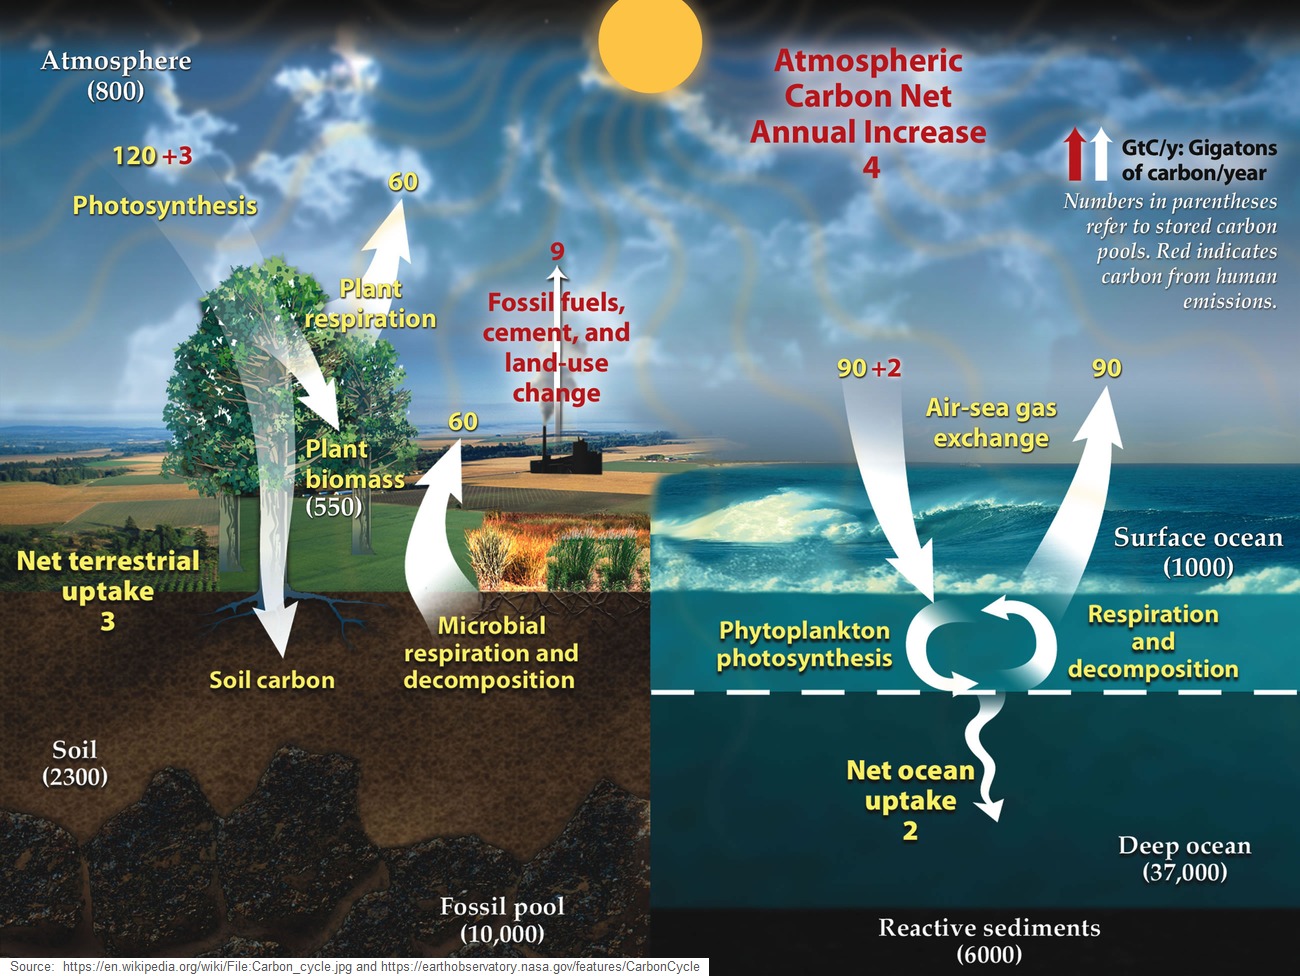
The corresponding Wikipedia article has a simpler diagram:
(click to enlarge)
