
8 hours ago,
17 tweets,
19 min read
@MayaEarls @chelseaeharvey [1️⃣ of 1️⃣6️⃣] @hausfath's study is nothing but spin. To excuse EXTREME inaccuracies of modeled projections that failed to anticipate negative feedbacks would mitigate GHG emissions, he substituted GHG level increases AFTER the effects of negative feedbacks, in place of emissions.
@MayaEarls @chelseaeharvey @hausfath [2️⃣] The studies which @hausfath claims were accurate were actually wildly INACCURATE, in part because they failed to anticipate how negative CO2 feedbacks like terrestrial greening and ocean processes would remove much of the anthropogenic CO2, mitigating its effect on climate.
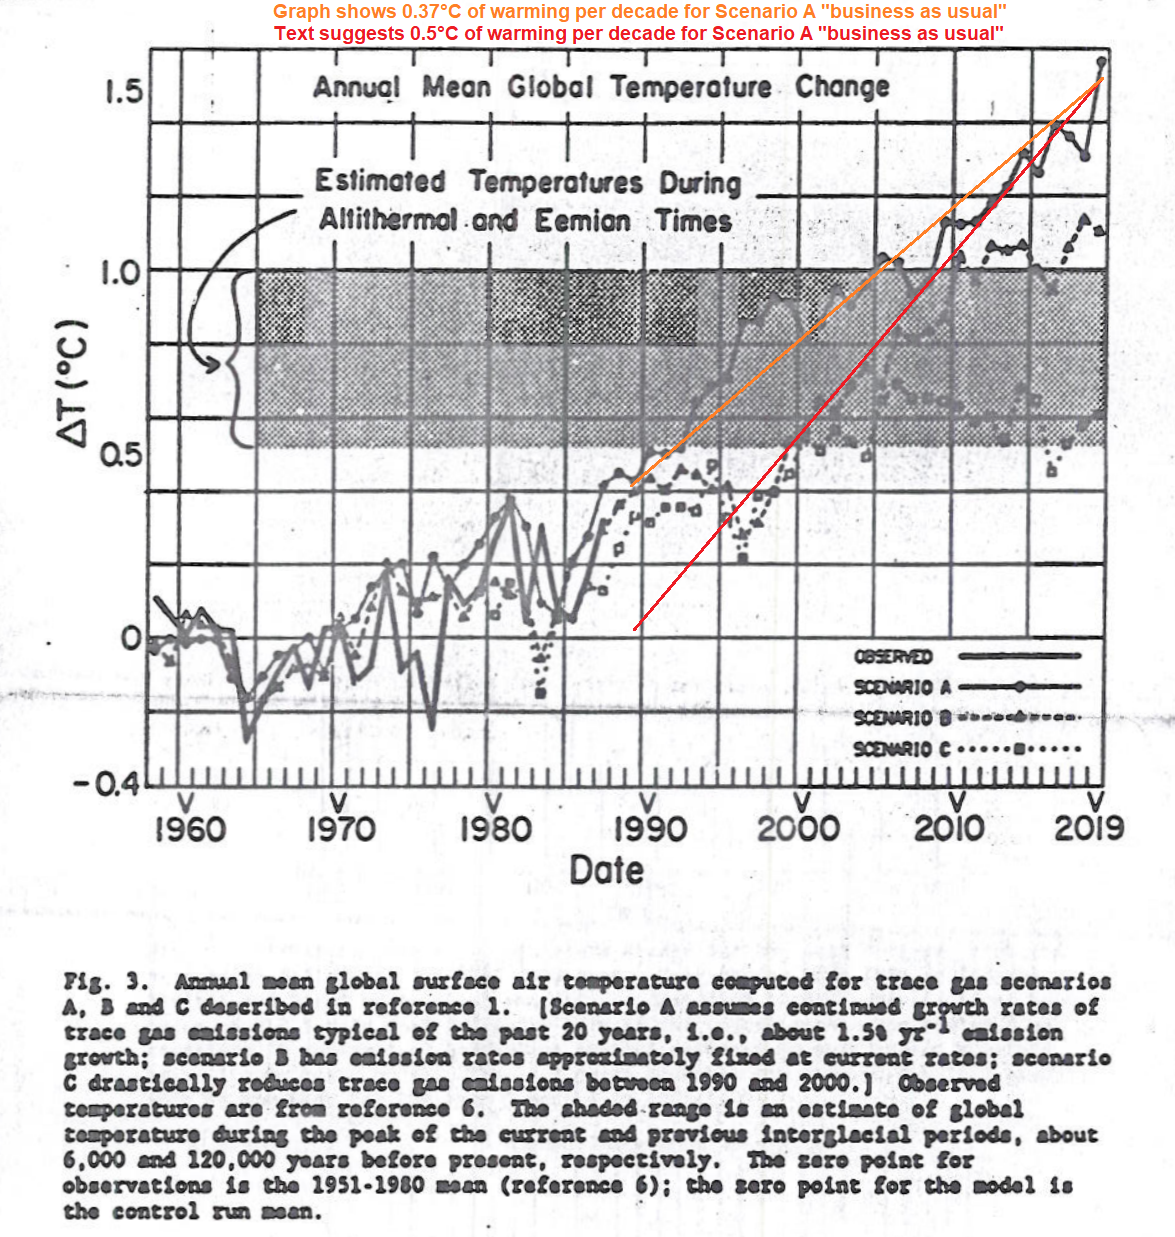
@MayaEarls @chelseaeharvey @hausfath [3️⃣] Here's Hansen et al 1988, reporting the results of GISS Model II. They projected +0.5°C/decade for their "Scenario A." (Oddly, their own graph showed only 0.37°C/decade, but the reviewers & editors apparently overlooked that inconsistency.)
sealevel.info/hansen88_predi…
sealevel.info/hansen88_predi…
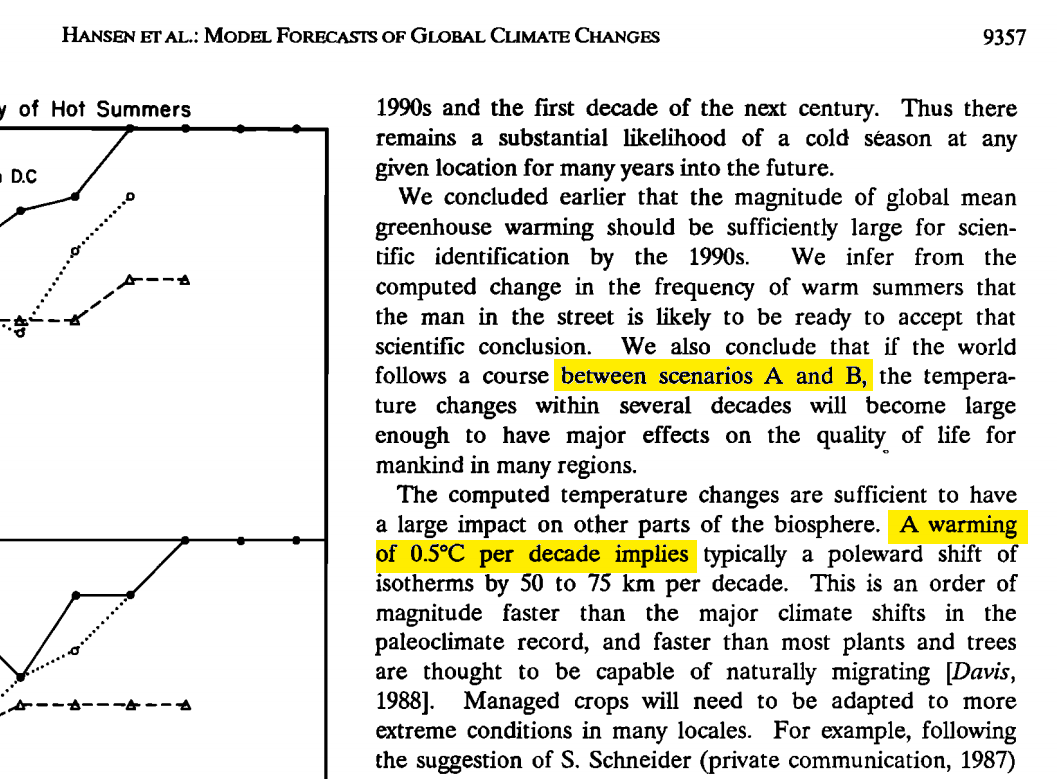
@MayaEarls @chelseaeharvey @hausfath [4️⃣] Note that in their discussion (shown in the previous tweet), Hansen & his seven coauthors implied that +0.5°C/decade was likely, referring to that rate as "the computed temperature changes."
@MayaEarls @chelseaeharvey @hausfath [5️⃣] Here's Hansen 1988's Fig 3 graph, showing 0.37°C/decade for Scenario A, rather than the 0.5°C that they claimed in the text. (You have to measure the graph slope to see that it's only 0.37°C.) I added the red & orange lines, showing the inconsistency:
sealevel.info/hansen88_fig3_…
sealevel.info/hansen88_fig3_…
@MayaEarls @chelseaeharvey @hausfath [6️⃣] Hansen told Congress that Scenario A was the "business as usual" scenario. (His purpose was to worry the politicians enough to get them to support creation of the IPCC, and it worked.) Here's the transcript:
sealevel.info/1988_Hansen_Se…
sealevel.info/1988_Hansen_Se…
@MayaEarls @chelseaeharvey @hausfath [7️⃣] Hansen 1988 (published eight weeks after his Congressional testimony) spun it to sound like Scenario A was conservative, until "resource constraints" eventually slow emissions growth, and Scenario B would become more plausible.
sealevel.info/hansen88_descr…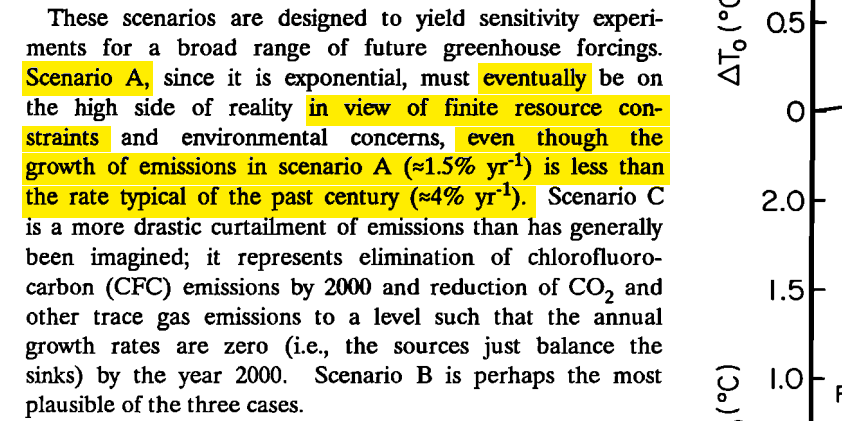
sealevel.info/hansen88_descr…
@MayaEarls @chelseaeharvey @hausfath [8️⃣] Under Hansen's scenario A, emissions would have increased by 1.5% per year, totaling 47% in 26 years. Actual CO2 emissions increased even faster: by an average of 1.97% per year, totaling 66% in 26 years. Here's the data:
cdiac.ornl.gov/ftp/ndp030/glo…
cdiac.ornl.gov/ftp/ndp030/glo…
@MayaEarls @chelseaeharvey @hausfath [9️⃣] @ClimateAudit discovered that in Hansen's Scenario A, in the long term most of the forcing was from CFCs, rather than from CO2. That result was not useful for supporting a campaign to curb CO2 emissions, so it was not mentioned in Hansen's paper.
@MayaEarls @chelseaeharvey @hausfath @ClimateAudit [1️⃣0️⃣] Hansen had told Congress Scenario A was "business as usual," yet it preposterously & dishonestly projected exponential increases in CFCs, even though the 1985 Vienna Convention for the Protection of the Ozone Layer & the 1997 Montreal Protocol promised to phase out CFCs.
@MayaEarls @chelseaeharvey @hausfath @ClimateAudit [1️⃣1️⃣] @hausfath wants you to think Scenario B was supposed to be the realistic one. That's obviously nonsense. Scenario B was “decreasing trace gas growth rates, such that the annual increase of the greenhouse climate forcing remains approximately constant at the present level.”
@MayaEarls @chelseaeharvey @hausfath @ClimateAudit [1️⃣2️⃣] Obviously we didn't have decreasing GHG emissions (except CFCs, per the Vienna Convention & Montreal Protocol, of course). Emissions of the major GHG, CO2, soared even faster than Scenario A. So Scenario B's assumptions obviously did not resemble what really happened.
@MayaEarls @chelseaeharvey @hausfath @ClimateAudit [1️⃣3️⃣] (Also, decreasing GHG growth rates OBVIOUSLY would cause DECREASING "annual increase of the greenhouse climate forcing," not an "approximately constant" annual increase. It is hard to imagine how an error THAT obvious made it through peer review!)
@MayaEarls @chelseaeharvey @hausfath @ClimateAudit [1️⃣4️⃣] Hansen et al wanted us to think Scenario A was the realistic one. They wrote:
"scenario A goes approximately through the middle of the range of likely climate forcing estimated for the year 2030 by Ramanathan… scenario B is near the lower limit of their estimated range."
"scenario A goes approximately through the middle of the range of likely climate forcing estimated for the year 2030 by Ramanathan… scenario B is near the lower limit of their estimated range."
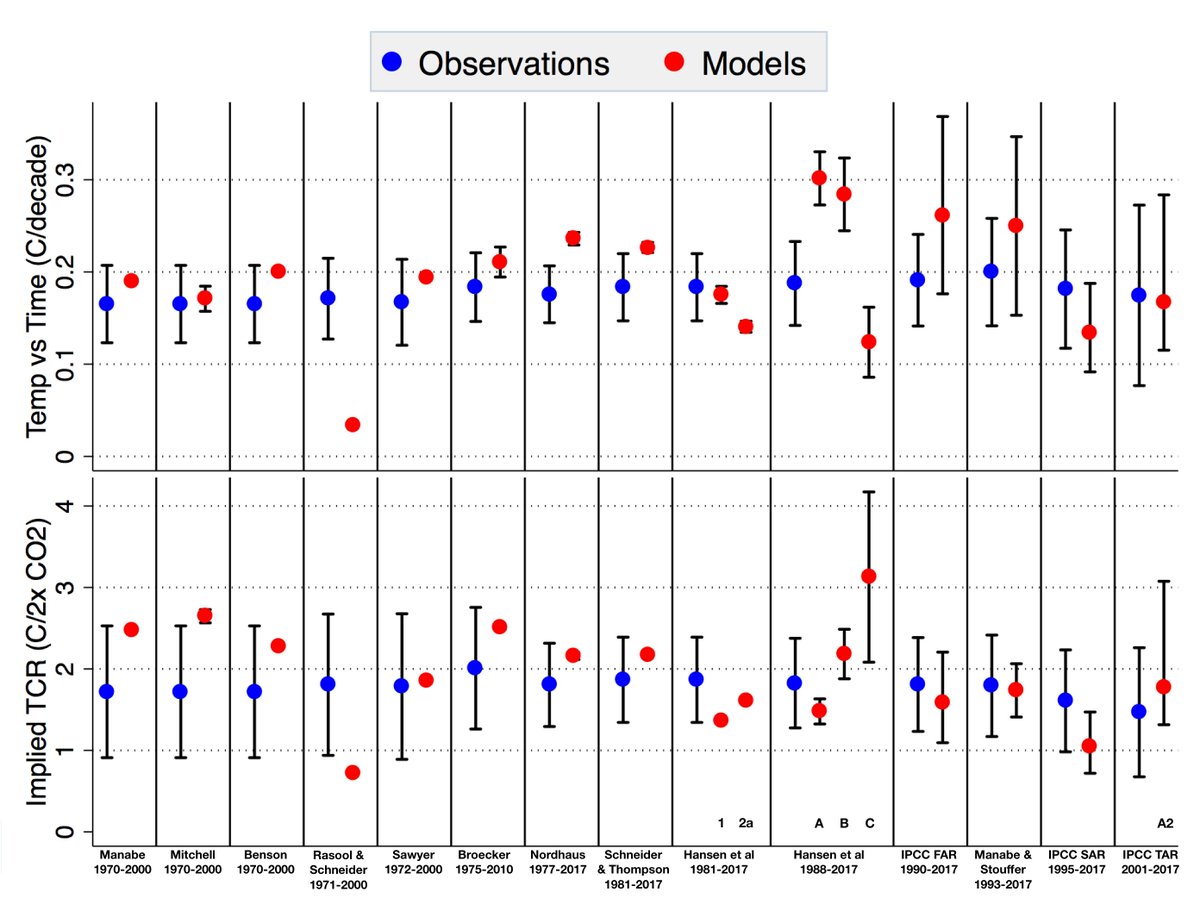
@MayaEarls @chelseaeharvey @hausfath @ClimateAudit [1️⃣5️⃣] Here's a comparison of Hansen et al 1988 vs. reality:
sealevel.info/hansen1988_ret…
Here's a very complete review, after 20 years (2008):
Here an excellent review, after 30 years (2018):
sealevel.info/hansen1988_ret…
Here's a very complete review, after 20 years (2008):
Here an excellent review, after 30 years (2018):
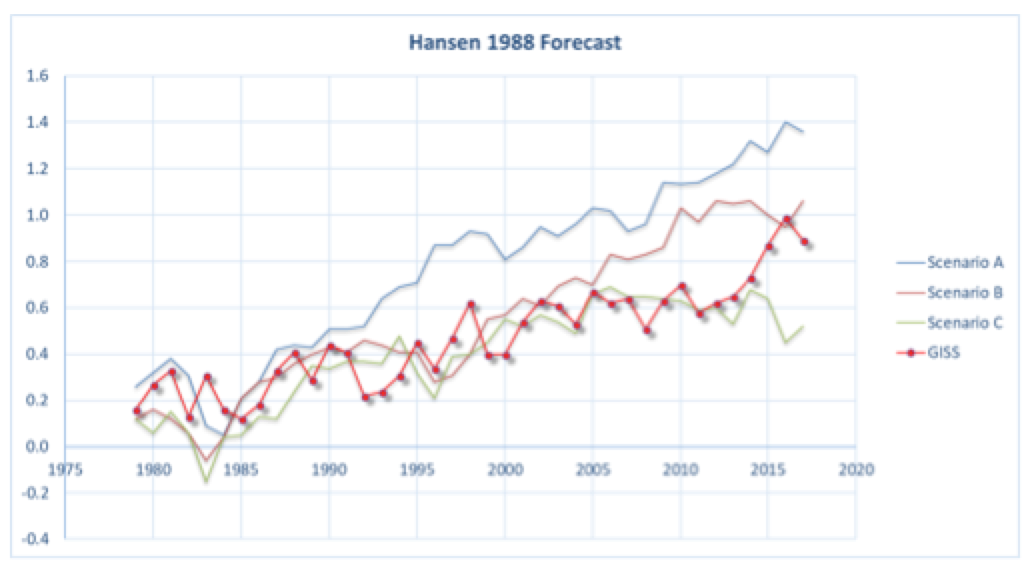
@MayaEarls @chelseaeharvey @hausfath @ClimateAudit [1️⃣6️⃣ of 1️⃣6️⃣] Temps increased only 1/3 to 1/4 as much as Hansen's Scenario A prediction, but @hausfath spins Hansen 1988 as "consistent with observations."
(@EcoSenseNow, care to weigh in? Do you think a 200% to 300% error is "consistent with observations"?)
Here's a graph: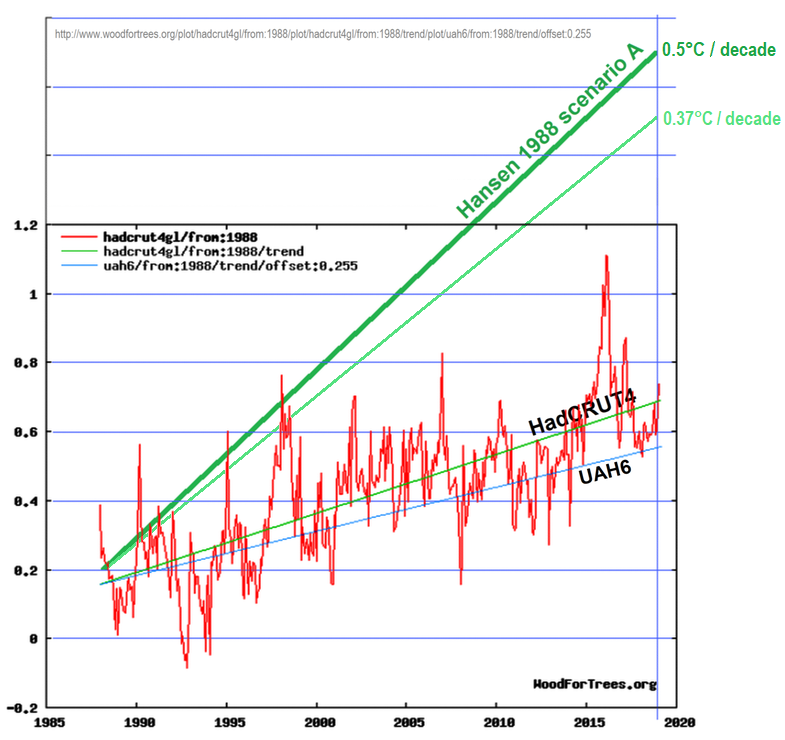
(@EcoSenseNow, care to weigh in? Do you think a 200% to 300% error is "consistent with observations"?)
Here's a graph:
@MayaEarls @chelseaeharvey @hausfath @ClimateAudit @EcoSenseNow @ThreadReaderApp unroll it, please


