On Fri, May 3, 2019 at 10:30 PM '________' wrote:
Actually, they've both (Dr. Ed Berry and Dr. David Appell) made some mistakes.
Ed got more wrong than David A. did, so I'll start with David A.'s mistakes, because there's less to write.
David A. says, "Where does the CO2 go? It goes into the atmosphere and the ocean and the soil."
And the biosphere! How could David A. forget the biosphere?
David A. says, "Ed makes a big deal that his model works for 14C. Well, of course it does -- there is only a single source of atmospheric 14C (cosmic rays), and a single sink (radioactive decay"
That's erroneous, on two counts.
First of all, there are two sources, not one, for atmospheric 14C. The other source of 14C is the "bomb spike," from atmospheric testing of nuclear weapons (which ended in the early 1960s)..
Atmospheric 14C concentration soared due to those tests, and then began rapidly falling when the atmospheric test ban treaty brought atmospheric nuclear weapon tests to a halt.
It is the famous, beautifully-exponential decay curve of 14C levels, following the atmospheric test ban, from which we derive the 16.6 year 14C "residence time" figure. Here’s a log-scale graph of the famous 14C “bomb spike:”
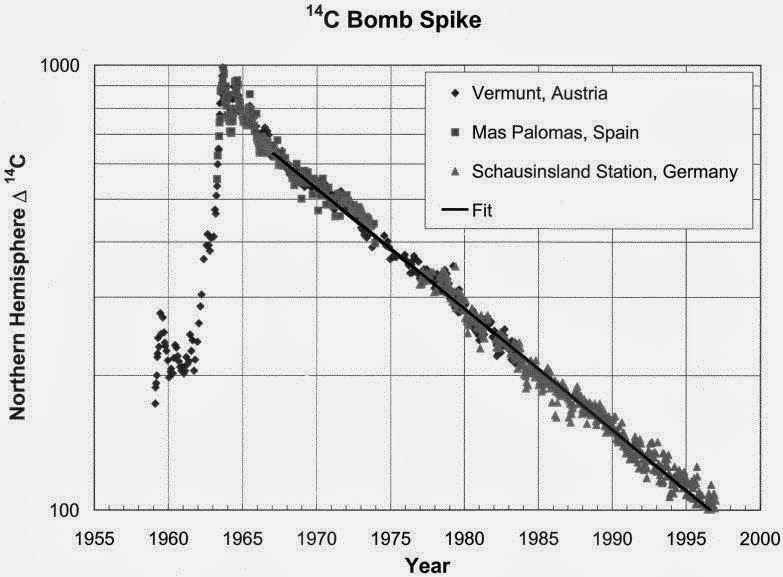
Secondly, the main sink for atmospheric 14C is not radioactive decay, it is exchange with other carbon reservoirs: mostly the oceans and biosphere, but also lakes, soil, etc. That's why, after the bomb spike, 14C levels fell with a half-life of only about 11.5 years, rather than 5,730 years.
David A. says, "humans are responsible for all of the excess carbon in today's atmosphere. And, in fact, nature still absorbs not only as much CO2 as it admits, but also about 50% more, of what humans emit -- the so-called airborne fraction."
That's mostly correct.
It is true that humans are responsible for increasing the CO2 level by about 130 ppmv, but I object to the word "excess" -- that's an ideological judgment, not a scientific one. The reality is that the 130 ppmv increase has merely eased the Earth's chronic shortage of atmospheric CO2.
The only other thing wrong with that statement is that David A. got the definition of "airborne fraction" backwards. It's the fraction of human CO2 emissions that remains in the atmosphere, not the fraction of human CO2 emissions removed by nature.
David A. says, "Consider this -- Ed has been trying to get his paper published for almost two years now. It has been rejected -- he won't say how many times. And he wonders why.... The answer is, because his claims are full of shit!"
Even though I agree that Ed's paper is flawed, those journal rejections are very weak evidence of it.
<RANT> (feel free to skip over my long, off-topic rant)
In quite a few fields, including climate science, the quality of the work has little to do with whether a paper is accepted for publication.
In fact, many refereed journals are dominated by junk science. Have you seen this expose of "grievance studies?"
A lot of what is published in the academic journals on climate science is as bad as "grievance studies." It is political hackery, masquerading as science.
Consider, for example, the recently concluded Jasper Ridge grasslands studies, from Stanford. They sought to find evidence that the "fertilization" benefits of eCO2 (elevated CO2) are countered by the warming effect of higher CO2 levels, so look at what they did.
First, note that it is generally understood that a doubling of CO2 should produce an average ground level irradiance increase of 3.7 ±0.4 W/m² before feedbacks (though Prof. Will Happer has found evidence that CO2's forcing is commonly overestimated by about 40%, due to inaccuracies in the modeling of the far fringes of CO2's fine line spectrum).
So the Stanford folks installed heat lamps over their experimental grass plots, to see the effect of that increased IR radiation on plants.
But to stunt the growth of the wild grasses at Jasper Ridge, Stanford researchers did not add 3 or 4 W/m² of ground level irradiance. They added 80 W/m² — equivalent to >20 “doublings” of CO2 (when the reality is that it is unlikely that mankind will ever drive outdoor CO2 levels up to even one doubling of the current level).
I’m not kidding! Yet they still got their papers published in the most prestigious journals!
When 80 W/m² proved insufficient to stunt the grasses enough, they increased it to 250 W/m² — equivalent to about 67 doublings of CO2.
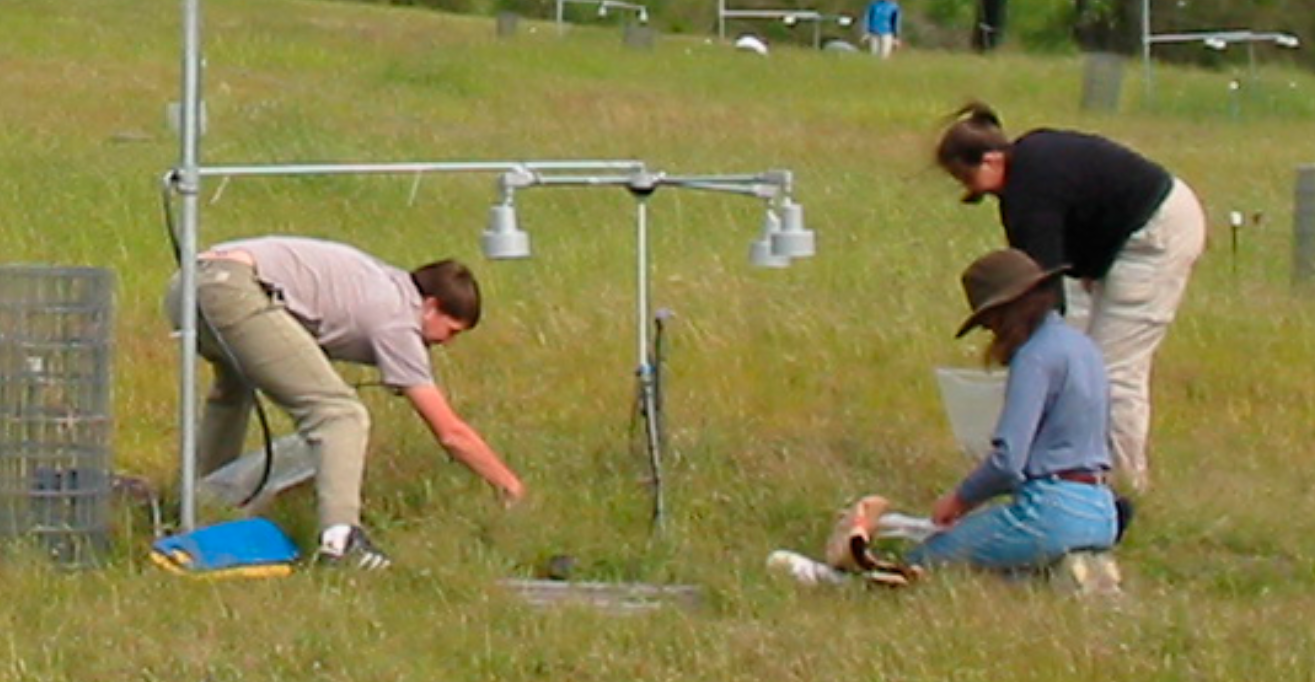
Here's a photo of the heat lamps they use at Jasper Ridge:
The amazing thing is that the journals aren't embarrassed to publish such drek. You can google search for “Jasper Ridge Global Change Experiment” to find out more.
But that's no more ridiculous than the anti-scientific "carbon budget" nonsense.
Note also that the processes which remove CO2 from the atmosphere cannot be significantly affected by the emission rate of "fossil" (anthropogenic) CO2. There simply is no plausible physical mechanism for such a coupling. It is the atmospheric CO2 level, not the CO2 emission rate, which primary governs the CO2 removal rate.
Now, as it happens, the CO2 removal rate has generally been approximately half the anthropogenic CO2 emission rate, for many years, with the result that CO2 levels have risen only about half as fast as would have happened without the negative feedbacks that remove CO2 at an accelerating rate. (Note: that acceleration apparently came as a big surprise for Hansen et al (1988), and is one of the main reasons their predictions 30 years ago were so far off.)
As CO2 emission rates have increased, CO2 levels have also unsurprisingly increased, and as CO2 levels have risen, CO2 removal rates have also unsurprisingly risen. The one surprising thing is the certainly coincidental fact that CO2 removal rates have been consistently around half the anthropogenic CO2 emission rates.
Back in 1988, Hansen & his seven illustrious co-authors equated emissions with level increases, which means they wrongly assumed that rising CO2 levels would not cause an acceleration in the processes that remove CO2. But now a remarkable number of supposed authorities on climate change make almost the opposite mistake: they suffer from the delusion that CO2 removal rates are governed by the emission rates, and that it is some sort of law that " half of the CO2 we emit stays in the atmosphere." That leads to imbecilic claims that anthropogenic CO2 emissions must be lowered to zero to stop the rise in CO2 levels, and to the idiotic notion of a " carbon budget."
Actually, if anthropogenic CO2 emission rates were merely halved, CO2 levels would completely cease rising, at least for quite a while.
</RANT>
________ continued:
...the selling point of Dr. Berry's work is the fact that absorption of 14C by the environment is a perfect match to the use of the continuity equations in atmospheric science when the correct residence time is applied, in this case, 16.5 years.
The 16.6 year 14C residence time derived from the bomb spike gives us an absolute lower bound on the effective residence time of anthropogenic CO2 emissions.
We know that the effective residence time of anthropogenic CO2 emissions must be longer than that, because we know that some of the processes which lower the 14C concentration in the atmosphere do so by exchanging molecules of 14CO2 with molecules of 12CO2, thus lowering the 14C concentration without lowering the total amount of CO2 in the atmosphere.
But Ed nevertheless claims that the effective residence time of CO2 in the atmosphere is much shorter than 16.5 years. In his Apr 14, 2019, 4:51 PM email he estimated "4 years." That is impossible.
...[snip]...
To thoroughly understand the CO2 emission lifetimes, you’d need to understand all the important processes which affect CO2 levels in the atmosphere — and some of those processes are not well understood.
Isotope studies don’t work well for attributing CO2 emission effects, because they get confused by the enormous fluxes of carbon between the atmosphere and other carbon reservoirs. When such fluxes are balanced, so they don’t affect atmospheric CO2 level, they still can greatly affect the isotope ratios. So all you can get from the isotope studies is a lower bound on the effective residence time. (Radioactive 14CO2 is 4.5% heavier than 12CO2, which causes very slight differences in rates of chemical & biological processes, but the differences are negligibly tiny, for our purposes.)
The low 14C “fossil” carbon we put into the atmosphere is (nearly) bio-equivalent to high-14C carbon, so the plants take up whichever CO2 molecules they encounter. Likewise, the oceans are happy to dissolve either kind of carbon dioxide. The atmospheric CO2 is constantly being exchanged with carbon in plants, animals, soil, and oceans.
So, even though mankind's CO2 emissions have elevated atmospheric CO2 levels by about 130 ppmv (over 45%), and even though the “fossil carbon” we've added to the atmosphere contains almost no 14C, there’s been only a modest drop in 14C percentage, after accounting for the bomb spike. That’s not because our emissions aren’t responsible for the increase in CO2 level, as some people suppose. It’s because most of the low-14C CO2 we put into the atmosphere has been exchanged for other CO2 in the oceans or biosphere.
It’s as if you had $280 in common $1 bills, and I gave you another $130 in Sacagaweas. At that point, 31.7% of your money would be in coins. But then you go play poker all night. You break even, so you still walk out with the same amount of money that you started with, but now you have only a few Sacagaweas, because most of them have been exchanged for other people’s money.
Even though you have only a few coins left in the morning, the reason you have $410 instead of $280 is that I gave you that big stack of coins.
In the Q&A after this (excellent!) lecture, Prof. Dick Lindzen reasons that the practical lifetime of emitted CO2, defined as the amount of time for atmospheric CO2 level to drop by 2/3, if CO2 emissions suddenly ceased, is about fifty years:
We have good measurements of atmospheric CO2 levels (starting in 1958), and we have good data for the greatest part of anthropogenic CO2 emissions (from economic data on the production and use of various fossil fuels), so we can do a reasonable calculation for the airborne fraction, and for the net CO2 removal rate.
It turns out that the net CO2 removal rate from the atmosphere can be very closely approximated as a simple function of the average atmospheric CO2 level. Dr. Roy Spencer wrote an excellent article about that here:
http://www.drroyspencer.com/2019/04/a-simple-model-of-the-atmospheric-co2-budget/
Using Dr. Spencer's "simple model," I wrote a tiny Perl program to simulate the effect on atmospheric CO2 level of a sudden cutoff of CO2 emissions. Counting 280 ppmv as "pre-industrial," 2/3 of the anthropogenic CO2 is gone from the atmosphere in 60 years:
#!/usr/bin/perl
# estimate CO2 removal rate in ppmv/yr as a function of CO2 level in ppmv, per Dr. Roy Spencer's "simple model"
sub removal_rate {
local($co2level) = shift;
local($removalrate) = 0;
local($co2elevation) = $co2level - 295.1;
local($ratio) = 47.73;
if ($co2level <= 295.1) {
$removalrate = 0;
} else {
$removalrate = $co2elevation * 0.0233;
}
return $removalrate;
}
# SIMULATE DECLINE IN CO2 LEVEL IF EMISSIONS SUDDENLY WENT TO ZERO
$co2level = 410;
$year = 2019;
print "Simulated CO2 level decline, with level starting at $co2level ppmv in $year, and zero emissions:\n";
while ($co2level > 300) {
printf("$year %5.1f\n", $co2level);
$year += 1;
$removalrate = &removal_rate( $co2level );
$co2level -= $removalrate;
}
Here's the result of a simulation run, with CO2 starting at 410 ppmv in 2019, and zero emissions:
2019 410.0
2020 407.3
2021 404.7
2022 402.2
2023 399.7
2024 397.2
2025 394.8
2026 392.5
2027 390.3
2028 388.0
2029 385.9
2030 383.8
2031 381.7
2032 379.7
2033 377.7
2034 375.8
2035 373.9
2036 372.1
2037 370.3
2038 368.5
2039 366.8
2040 365.1
2041 363.5
2042 361.9
2043 360.4
2044 358.8
2045 357.3
2046 355.9
2047 354.5
2048 353.1
2049 351.7
2050 350.4
2051 349.1
2052 347.9
2053 346.6
2054 345.4
2055 344.3
2056 343.1
2057 342.0
2058 340.9
2059 339.8
2060 338.8
2061 337.8
2062 336.8
2063 335.8
2064 334.9
2065 333.9
2066 333.0
2067 332.2
2068 331.3
2069 330.4
2070 329.6
2071 328.8
2072 328.0
2073 327.3  <== residence time (e-folding time) = 54 years (using 280 ppmv as base)
2074 326.5
2075 325.8
2076 325.1
2077 324.4
2078 323.7
2079 323.0  <== two-thirds of the anthropogenic CO2 is gone in 60 years (using 280 ppmv as base)
2080 322.4
2081 321.7
2082 321.1
2083 320.5
2084 319.9
2085 319.3
2086 318.8
2087 318.2
2088 317.7
2089 317.2
2090 316.6
2091 316.1
2092 315.7
2093 315.2
2094 314.7
2095 314.3
2096 313.8
2097 313.4
2098 312.9
2099 312.5
2100 312.1
2101 311.7
2102 311.3
2103 311.0
2104 310.6
2105 310.2
2106 309.9
2107 309.5
2108 309.2
2109 308.9
2110 308.5
2111 308.2
2112 307.9
2113 307.6
2114 307.3
2115 307.1
2116 306.8
2117 306.5
2118 306.2
2119 306.0
2120 305.7
2121 305.5
2122 305.2
2123 305.0
2124 304.8
2125 304.5
2126 304.3
2127 304.1
2128 303.9
2129 303.7
2130 303.5
2131 303.3
2132 303.1
2133 302.9
2134 302.7
2135 302.6
2136 302.4
2137 302.2
2138 302.0
2139 301.9
2140 301.7
2141 301.6
2142 301.4
2143 301.3
2144 301.1
2145 301.0
2146 300.9
2147 300.7
2148 300.6
2149 300.5
2150 300.3
2151 300.2
2152 300.1
Warmest regards,
Dave
|
|